I
Automatic 1004MC.
Half-open market-condition windows, stratified mini-grids, and a templated trend verdict — every panel ready to paste into the report without another spreadsheet open.
Replaces manual grid work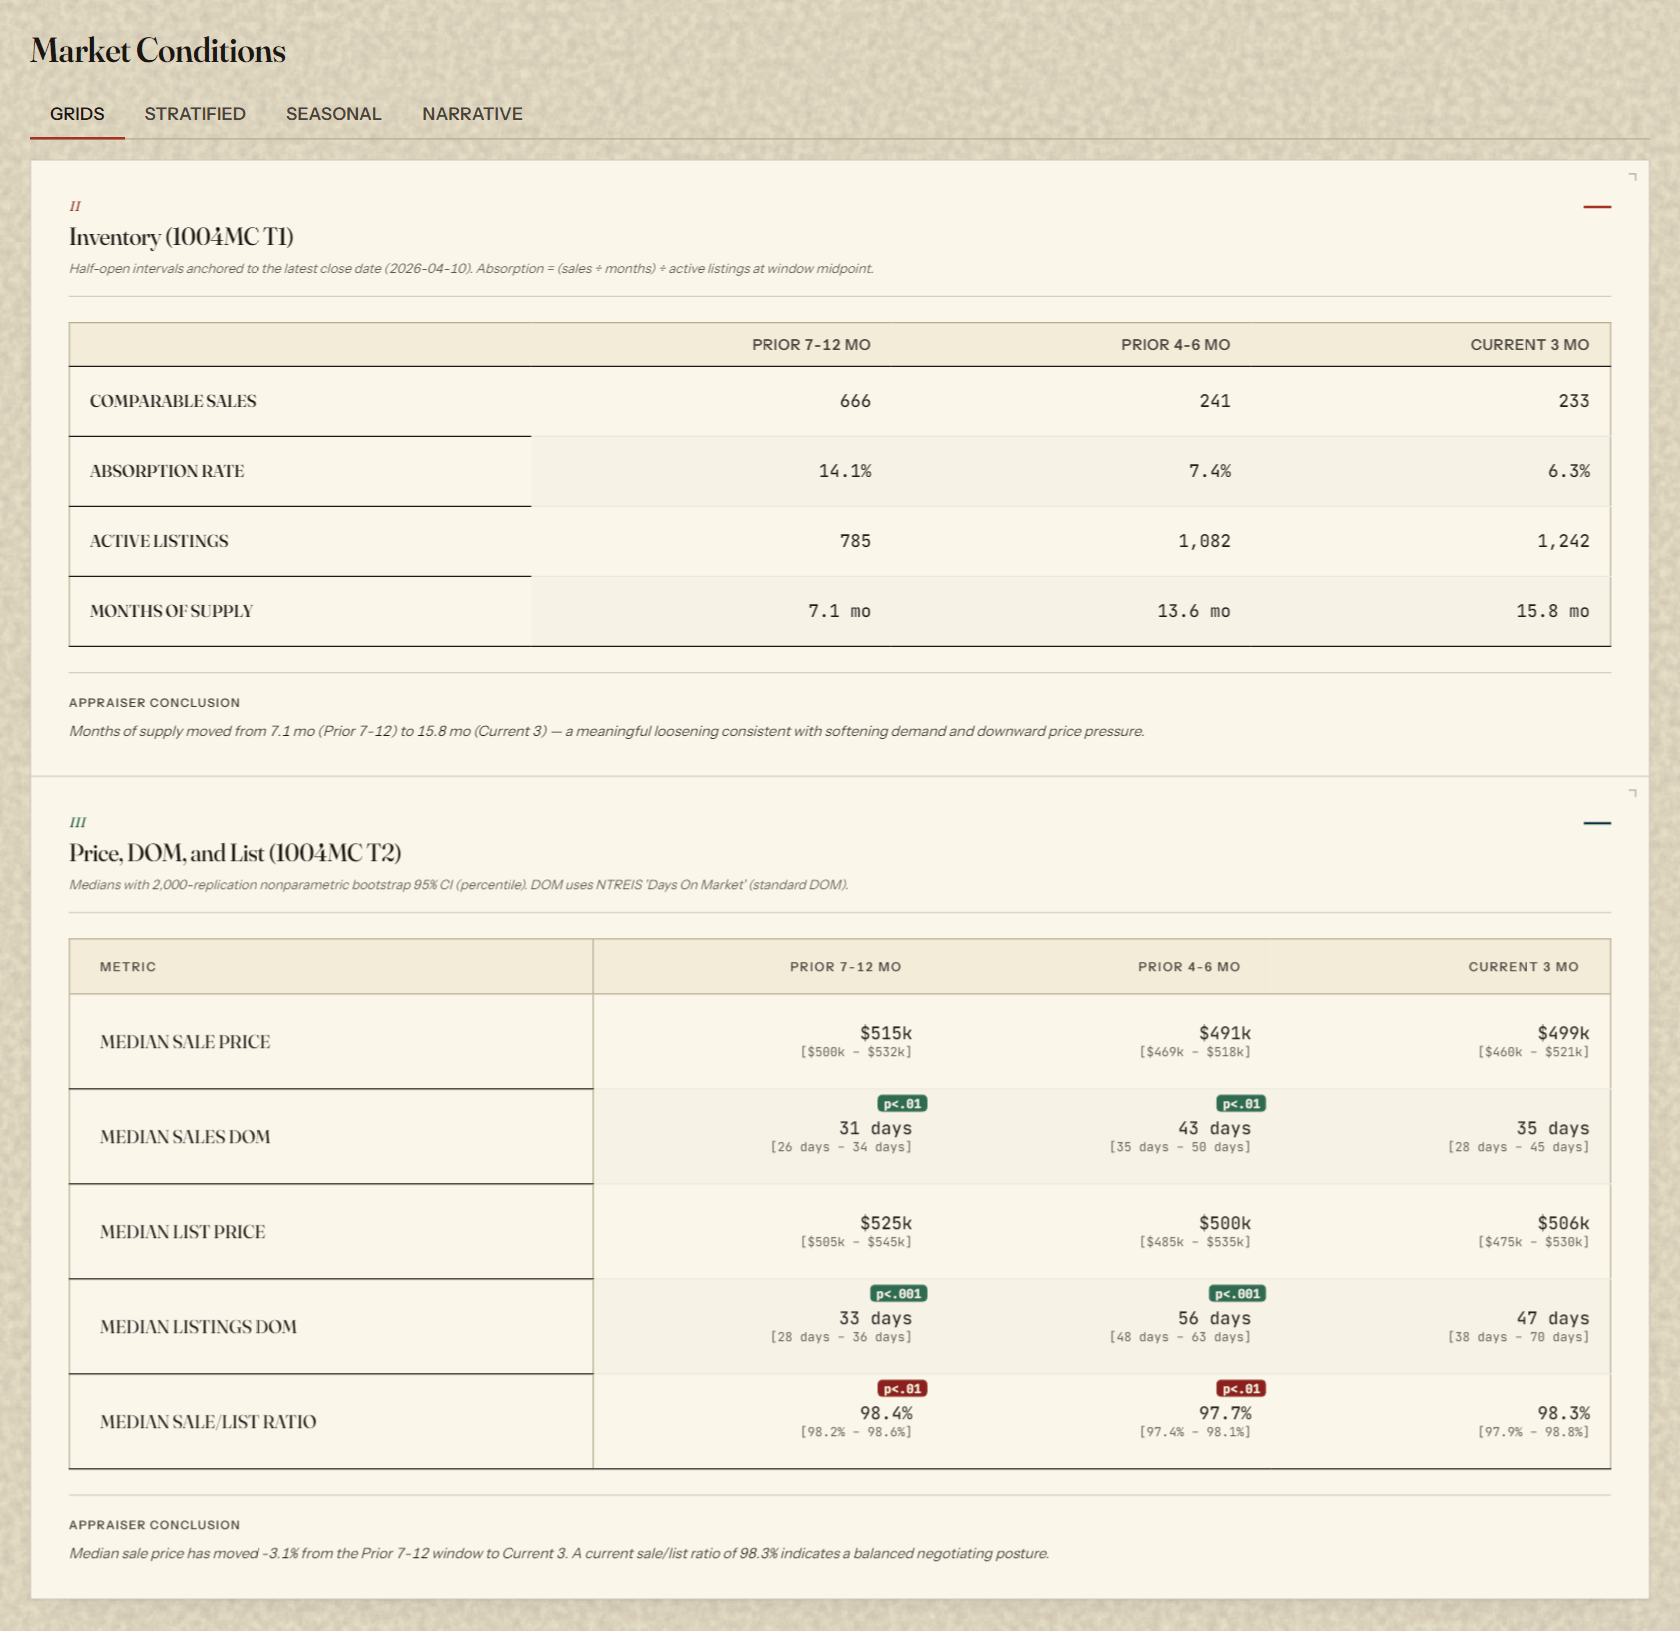
Seven hours. Zero code. One dashboard on your desktop by the end of the afternoon.
A seven-hour pre-recorded workshop where you'll build a working market-analysis app on your own desktop, using your own data — guided every step by Hansel Dobbs.
Register for ValuSignal 2026 →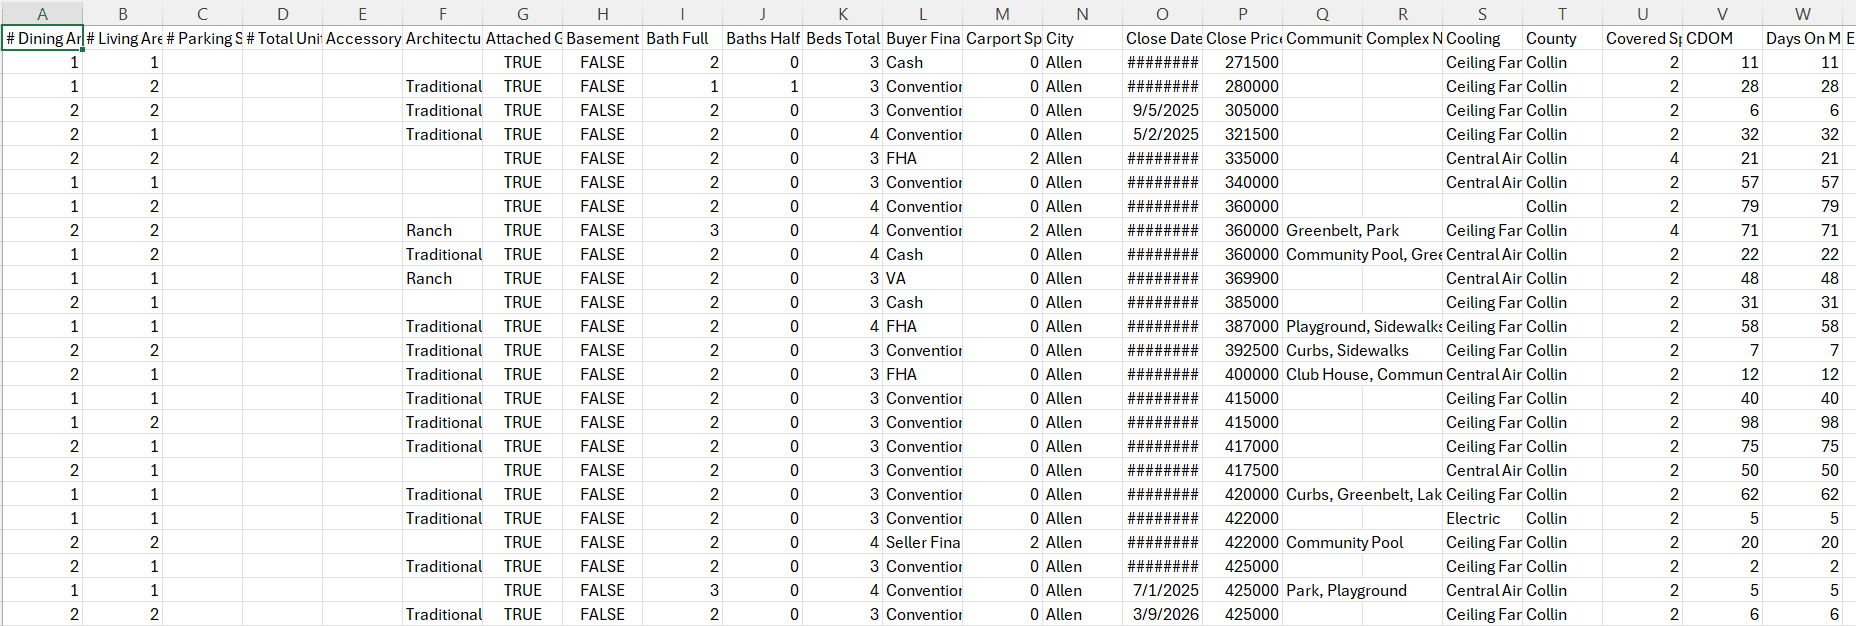
You won't leave with a dashboard we hand you. You'll leave with the skills to build one for every market you work — and the confidence that the numbers will hold up in a workfile.
Half-open market-condition windows, stratified mini-grids, and a templated trend verdict — every panel ready to paste into the report without another spreadsheet open.
Replaces manual grid work
Every closed sale aggregated to a hex cell with median price, sale count, and a 95% bootstrap confidence interval surfaced in the tooltip. Reads like a map. Reasons like a stats engine.
Replaces static MLS tape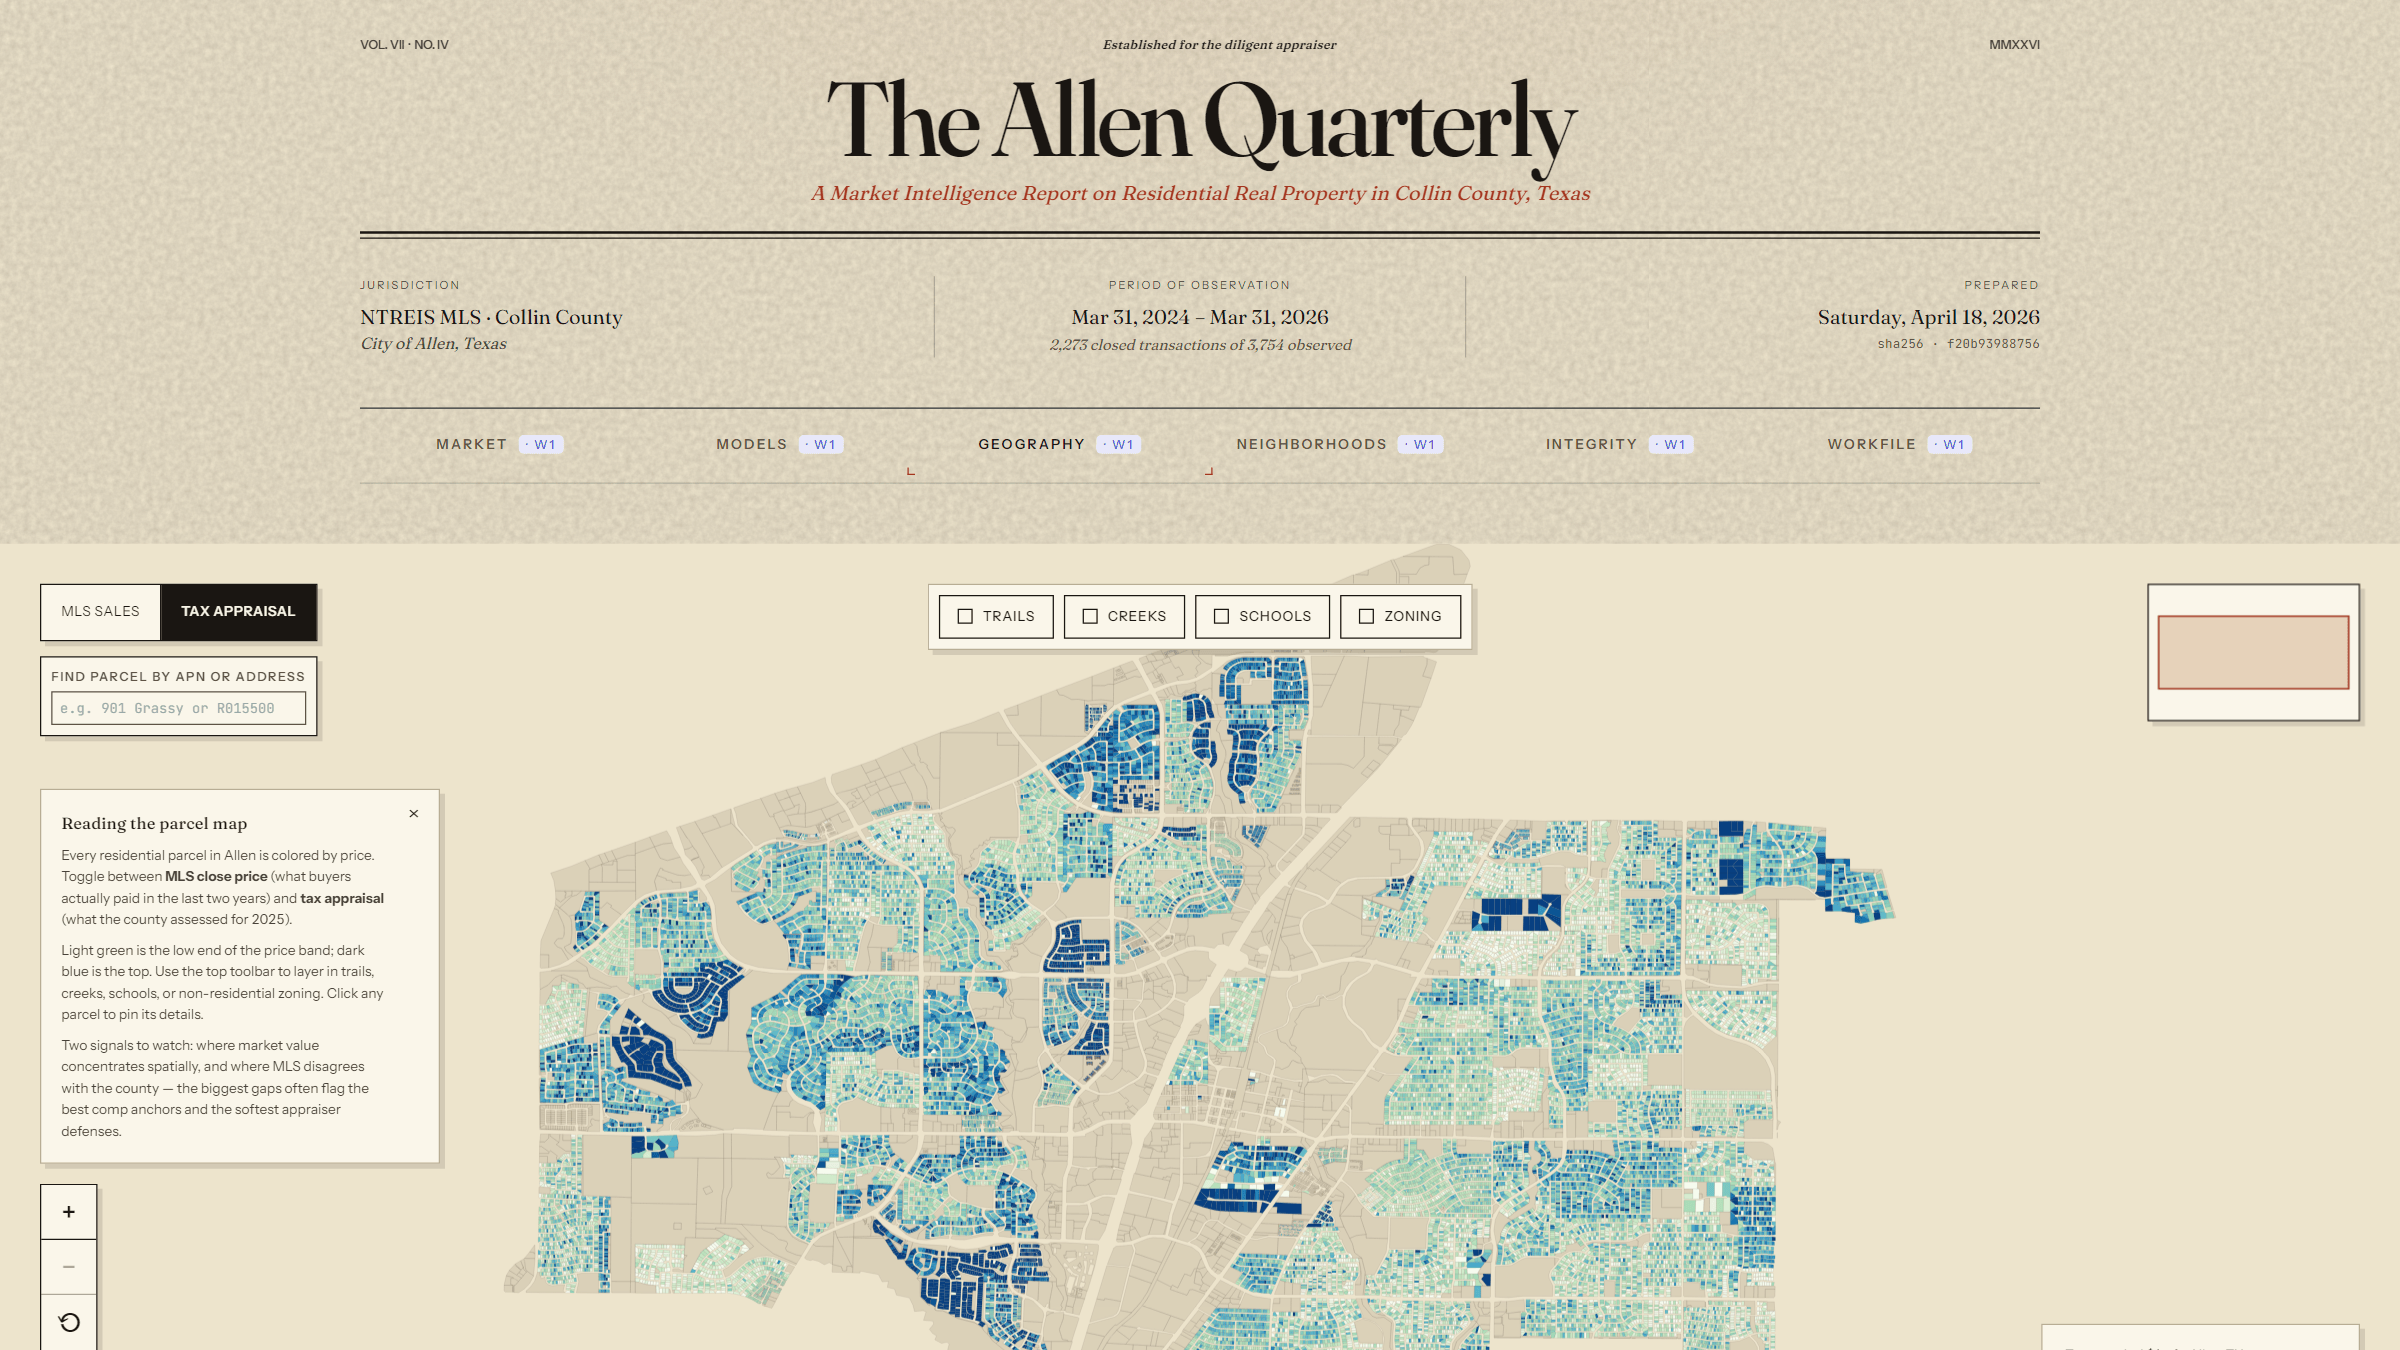
OLS and semi-log hedonic models with VIF diagnostics, Cook's D influence flags, and bootstrap coefficient intervals. The math your review board wanted before review boards were a thing.
Replaces gut-feel adjustment logic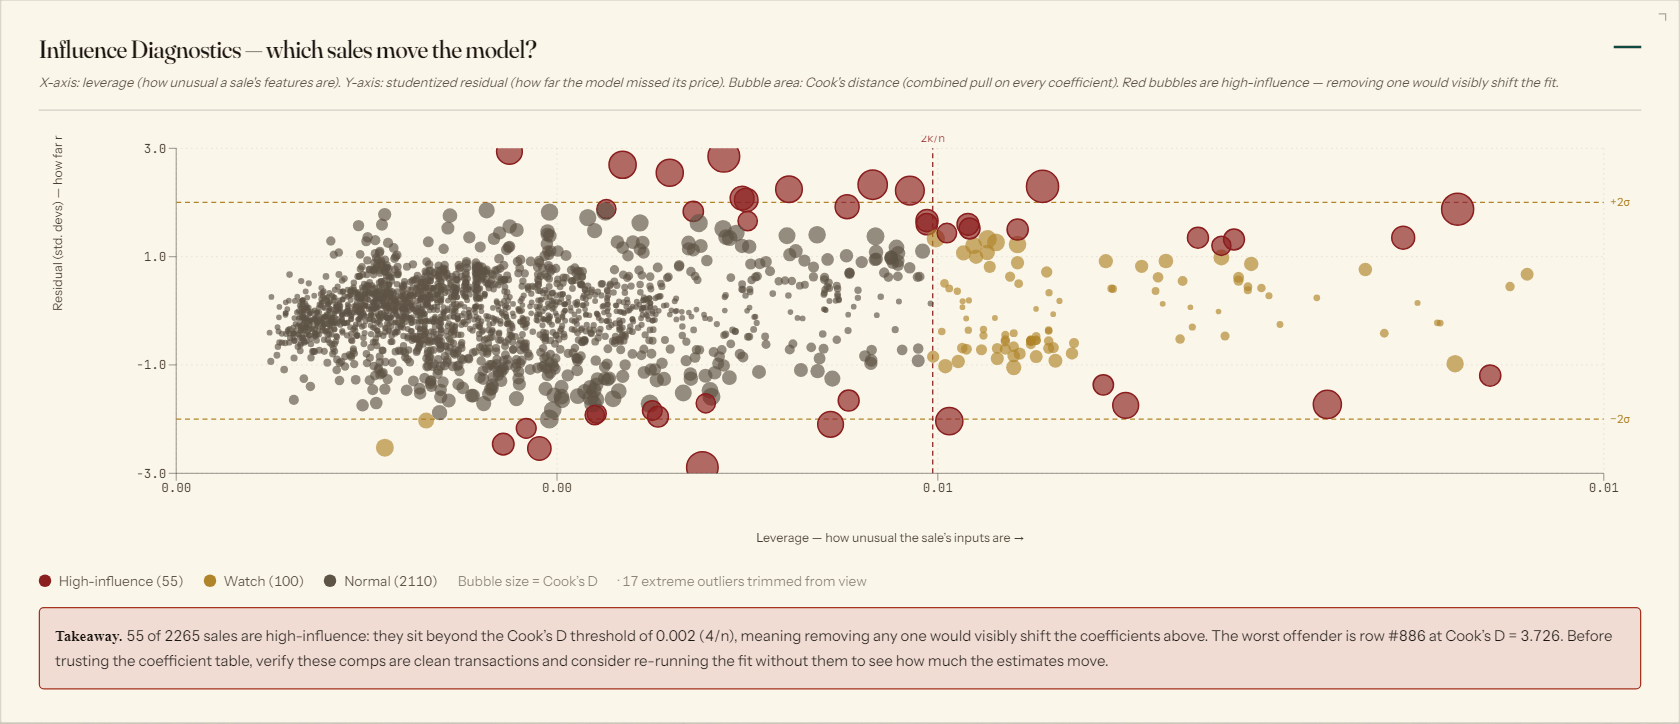
Put two subdivisions side by side on the same axes — no five browser tabs, no copy-paste into Excel, no losing track of which median belongs to which subject area.
Replaces multi-window tab juggling
Auto-generated exhibit with Standard 3 documentation, data provenance, and a certification statement — one click, every time, ready to drop into the workfile folder.
Replaces fifteen minutes of formatting per assignment
Wherever your practice needs attention, the same toolkit reshapes to fit. Four examples of tools working appraisers build with Claude Code:
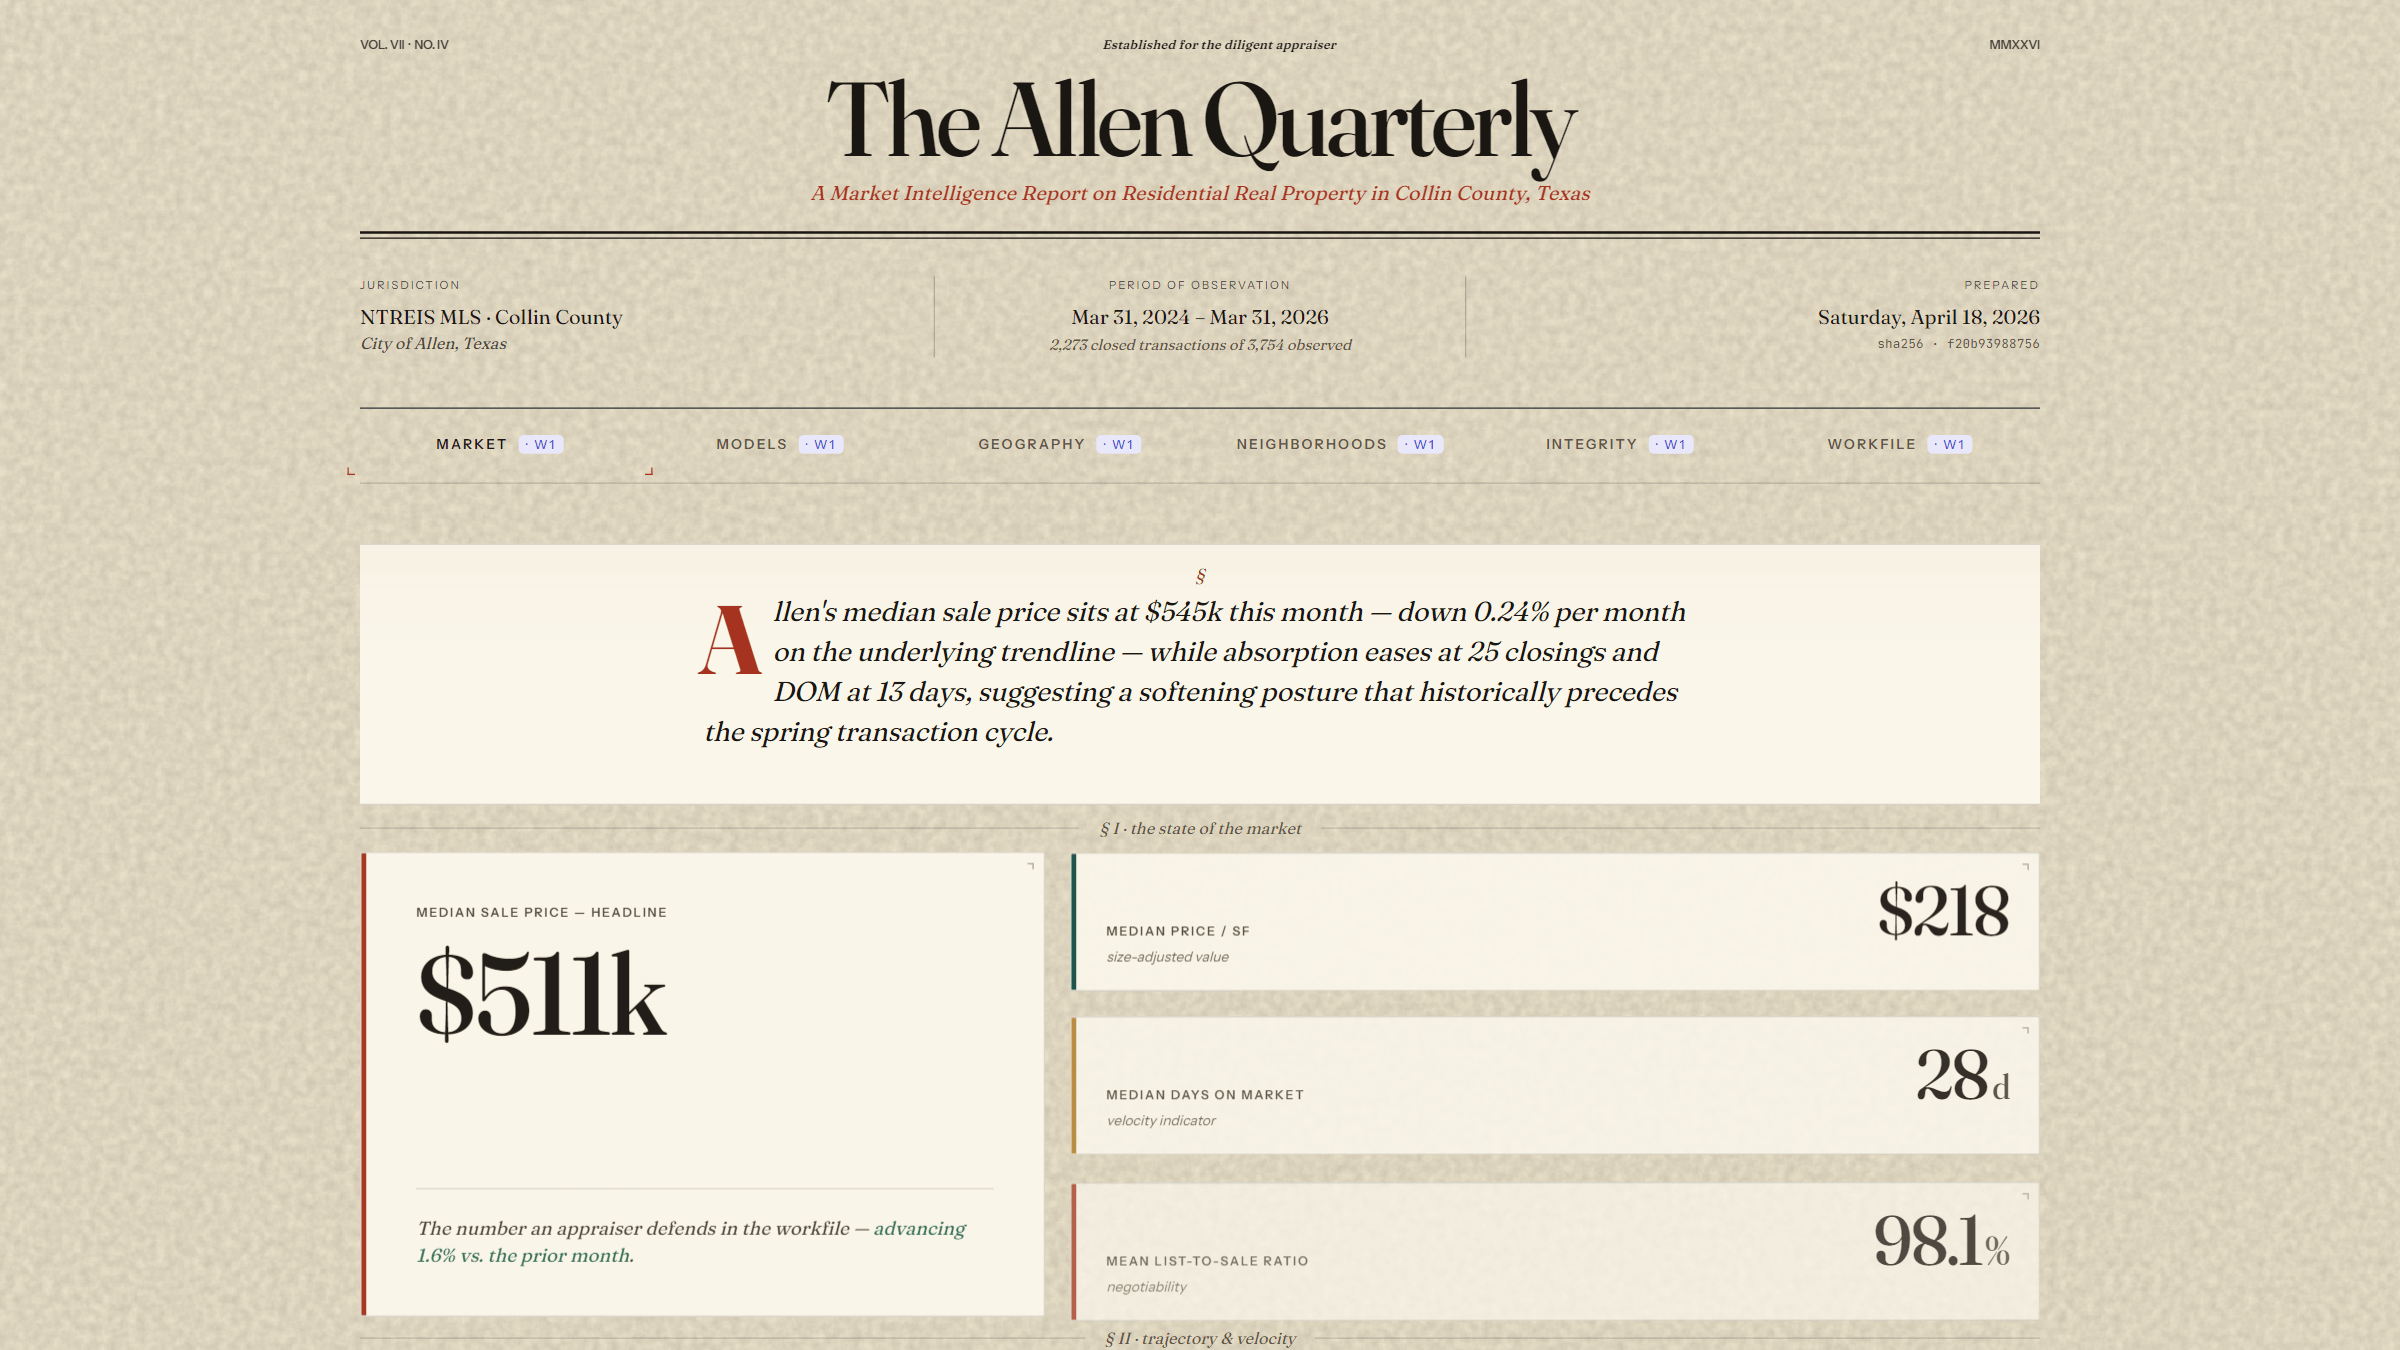
Build your own Quarterly for any market you cover — a dashboard that assembles your 1004MC, heatmap, and hedonic adjustments from a fresh MLS export in a few keystrokes.
A pre-submission review assistant that catches the formatting, methodology, and narrative issues that generate reviewer queries — before the report ever leaves your desk.
A structured response workflow for reconsiderations of value — research scaffolding, rebuttal templates, and citation formatting that writes the bulk of the reply to a defensible standard.
Assignment intake, fee quoting, scheduling, comp archiving — small automations shaped to how your practice already works, not how someone else's Excel template expected it to.
The same environment most engineers learned by osmosis — demystified for the appraisers who actually need it.

Get the environment running on your machine. One command, fifteen minutes, and you're past the setup hurdle every self-taught tutorial leaves you stuck on.
The canvas where everything happens. We'll walk through opening a folder, trusting a workspace, reading a file tree, and editing without panic — the everyday skills most developers learned by osmosis.
When to leave VS Code and work in the browser, when to stay local, and why the two are good at different things. Web for brainstorming and research, local for building the thing you'll actually use.
How to make Claude design the work before writing a line of code. This is where most of the wins are. A good plan turns a four-hour debugging slog into a fifteen-minute implementation.
Reusable expertise you invoke by name. The same instincts a senior appraiser develops over twenty years — packaged, so Claude starts from "experienced" instead of "blank page" on every file.
Loading your MLS export, pointing the app at the right columns, and trusting what comes out. This is where the app stops being Hansel's demo and starts being your tool.
Three structural guarantees every appraiser should expect from an AI-assisted tool — and how we wire each one into the build.
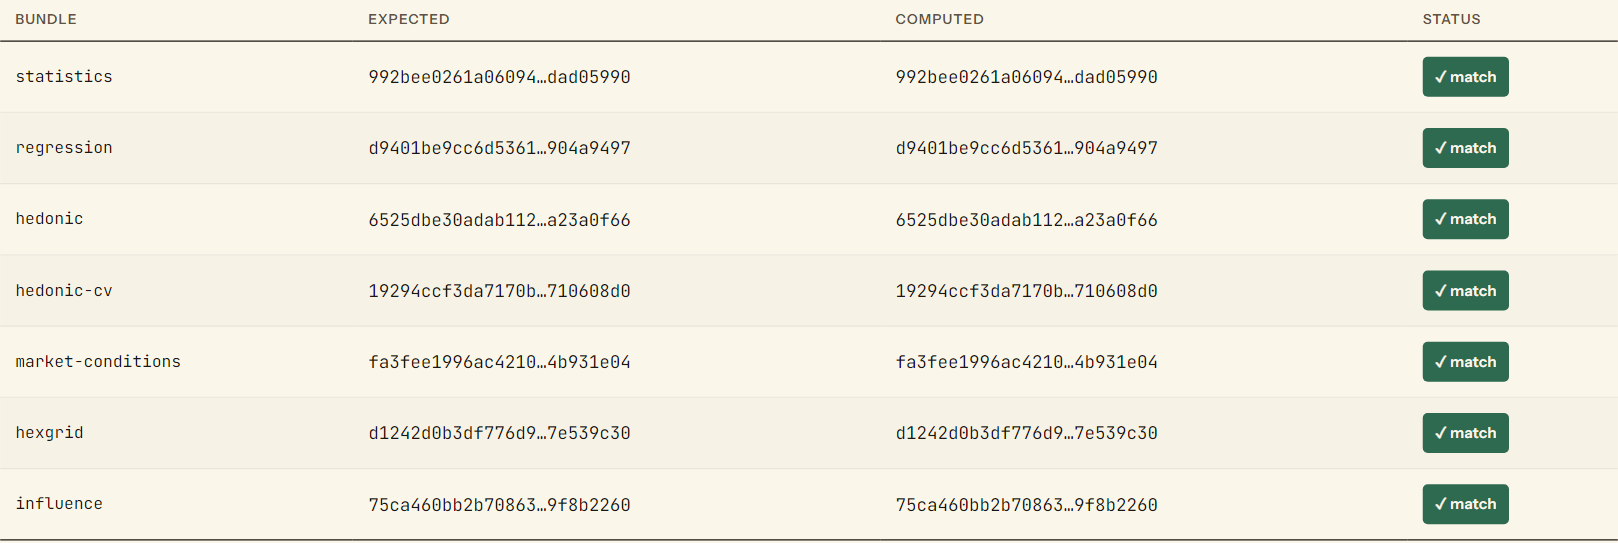
Every number on the dashboard — every median, every regression coefficient, every p-value — is computed deterministically from your MLS data using standard statistical formulas in pinned, version-locked libraries. No language model touches a calculation. The statistics are cross-checked against an independent Python reference implementation running at pinned versions; any drift between the two fails the build. Modeled values are always labeled as modeled. AI was used to help build the tool; AI does not produce the numbers you see.
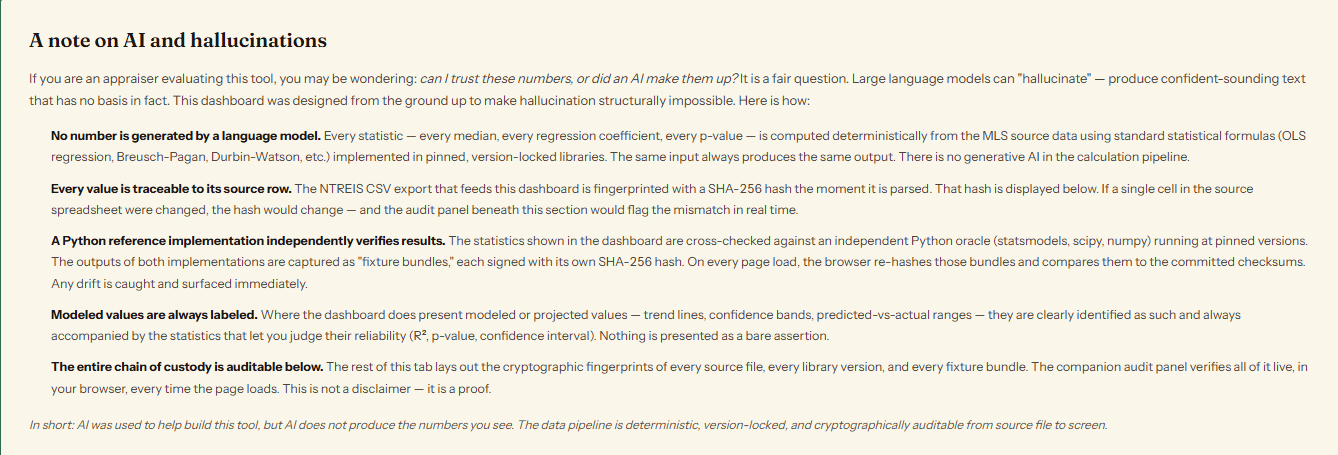
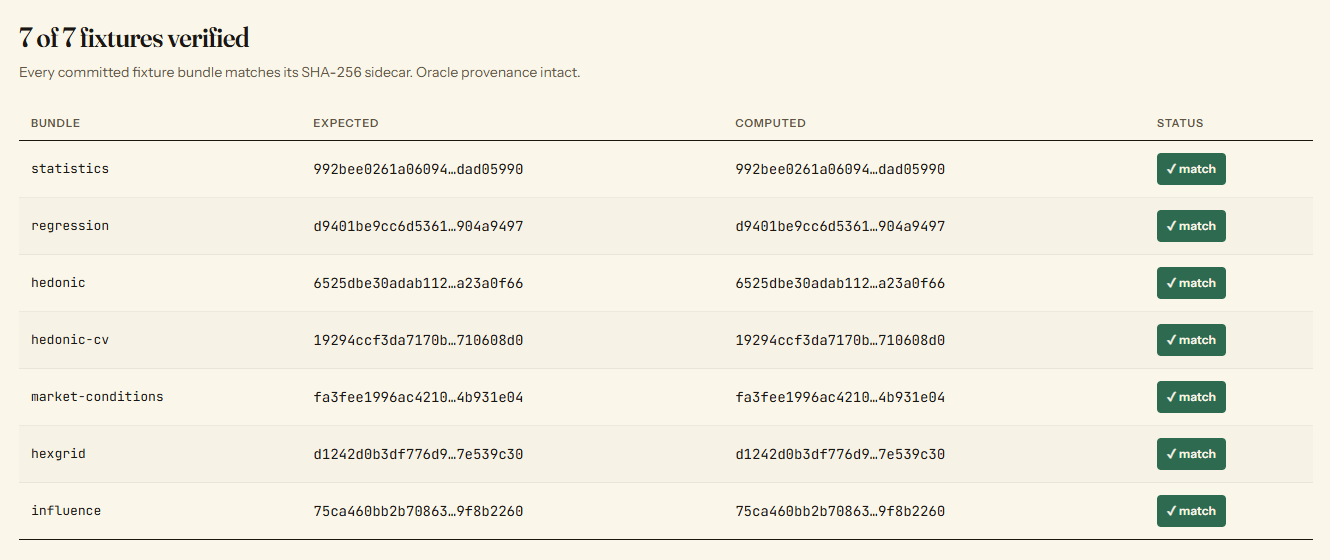
The calculations in the reference dashboard are compared bitwise against an independent Python implementation. If a computed number ever differs from the reference by so much as a cent, the test suite fails and nothing ships. This is the technique professional software teams use to catch regressions; in an AI-assisted workflow it doubles as a hallucination alarm.
In the workshop, we'll walk through adding the same pattern to your own app — an automatic work log that tracks every analysis, every data source, and every computation without a separate documentation step. The result is a workfile that carries its own audit trail, so how did you get this number becomes a question you can answer a year from now without opening the original spreadsheet.

Most AI workshops for appraisers are taught by developers who've never done a 1004. This one is taught by an appraiser who learned to code because he got tired of hearing the tool wasn't quite ready for us.
Included free with every ValuSignal 2026 registration. Access continues for three months after the live conference, so you can return to any lesson when a real 1004 is on your desk.
Register for ValuSignal 2026 →