
The Signal / Market analysis / October 25, 2026
Dallas County's housing market is splitting again, as it did in 2005Price tiers that pulled apart in the last cycle are pulling apart again, at about half the old speed
In both cycles the bottom third of Dallas County home prices stalled first while the top third kept climbing. The 2005 split ran on foreclosures and cut low-tier values by 45%. The current one is widening at about half that speed, with seller concessions and FHA loans where bank sales used to be.
- Closed sales, 2004 to 2012
- 186,738
- Closed sales, 2020 to 2026
- 110,191
- Recent FHA, VA and USDA buyers estimated underwater
- about 7,000
Our October analysis of Dallas County found the same house selling for 48% more than in late 2020 in the top third of prices, and 23% more in the bottom third. Through the 2021 and 2022 run-up the three tiers had moved within a few points of each other; the gap opened after mortgage rates passed 6% in 2022. To see where a split like this has led before, we went back to the last one.
This feature applies the same repeat-sales method to the last cycle's sales, January 2004 through December 2012, and to this one's, tier by tier. In the earlier cycle the bottom third of prices peaked in early 2005, the top third kept rising for two more years, and the low tier did not find a floor until 2011. The order of events today matches it closely. The pace, the financing and the people buying at the bottom do not.
For lenders, servicers and anyone who reviews collateral, the comparison answers a practical question: which early readings in 2006 told you the low tier was in trouble, where those readings stand now, and how many recent buyers have little or no equity if prices in the bottom tier keep sliding.
The same split, running at about half the speed
To compare the two cycles, the chart sets each era's tier indexes to zero at the quarter the bottom third peaked: the first quarter of 2005 in the last cycle and the second quarter of 2022 in this one. Dashed lines are 2005 onward; solid lines are 2022 onward. Scroll to step through the quarters.
Quarters after the low tier peaked
- High tier, now
- +6.7%
- Low tier, now
- −11.8%
- High tier, then
- +4.2%
- Low tier, then
- −41.5%
Then: Q4 2012. Now: data ends Q3 2026.
The pattern repeats: in both eras the low tier turned first and the high tier kept going. What differs is the speed. 17 quarters after its peak, averaging the last two quarters, the current low tier is down about 9% and the gap between the top and bottom thirds, measured from the peak, is about 20%. The last cycle opened a gap that wide in 8 quarters, by Q1 2007. At the same 17-quarter mark, in Q2 2009, the earlier low tier was down 37% and the gap was 63%.
The high tier also behaved differently. In the last cycle it kept rising for nine quarters after the low tier peaked, then gave back most of that gain in 2008 and 2009 and ended 2012 near its 2005 level. In this cycle it has kept rising for 17 quarters and stands about 8% above its mid-2022 level, on the same two-quarter average.
How the last split ran, quarter by quarter
The county as a whole peaked in Q1 2005 at 104 and bottomed at 78 in Q1 2011, a decline of 25%. That average hides three different paths. The low tier fell from 101 in Q1 2005 to 56 in Q2 2011. The high tier rose to 117 in Q2 2007 and ended 2012 at 111. Switch to the inflation-adjusted view to see the same lines in 2004 dollars; the dotted line is the consumer price index on the same base.
Index values are nominal unless the toggle is set to inflation-adjusted, which divides by CPI-U on the same base. Quarterly values rest on 120 to 220 pairs per tier.
Dallas was spared the worst of the national bust. The S&P CoreLogic Case-Shiller index for the Dallas metro fell 11.2% from its June 2007 peak to its February 2009 low, against a 27.4% decline in the national index.1 Research from the Federal Reserve Bank of Dallas links the Texas constitution's 80% cap on home equity borrowing to lower mortgage default rates in that period.2 Inside Dallas County, the losses were concentrated in the bottom tier, which the metro average blends away.
In 2004 dollars the low tier finished the period at 48, a real loss of about 52%, and the high tier at 89. Consumer prices rose 24% from early 2004 to late 2012, so even the high tier's nominal gain did not keep pace with inflation.
An independent index points the same way. The Federal Housing Finance Agency's experimental zip code index, which is built from Fannie Mae and Freddie Mac loans and therefore leaves out most cash, FHA and bank sales, rose 21% from 2004 to 2012 in the third of Dallas County zips with the highest 2004 sale prices and fell 4% in the lowest-priced third.3 The gap is smaller than in our index because whole zips mix price tiers and because the FHFA data leaves out the sales where most of the losses were taken.
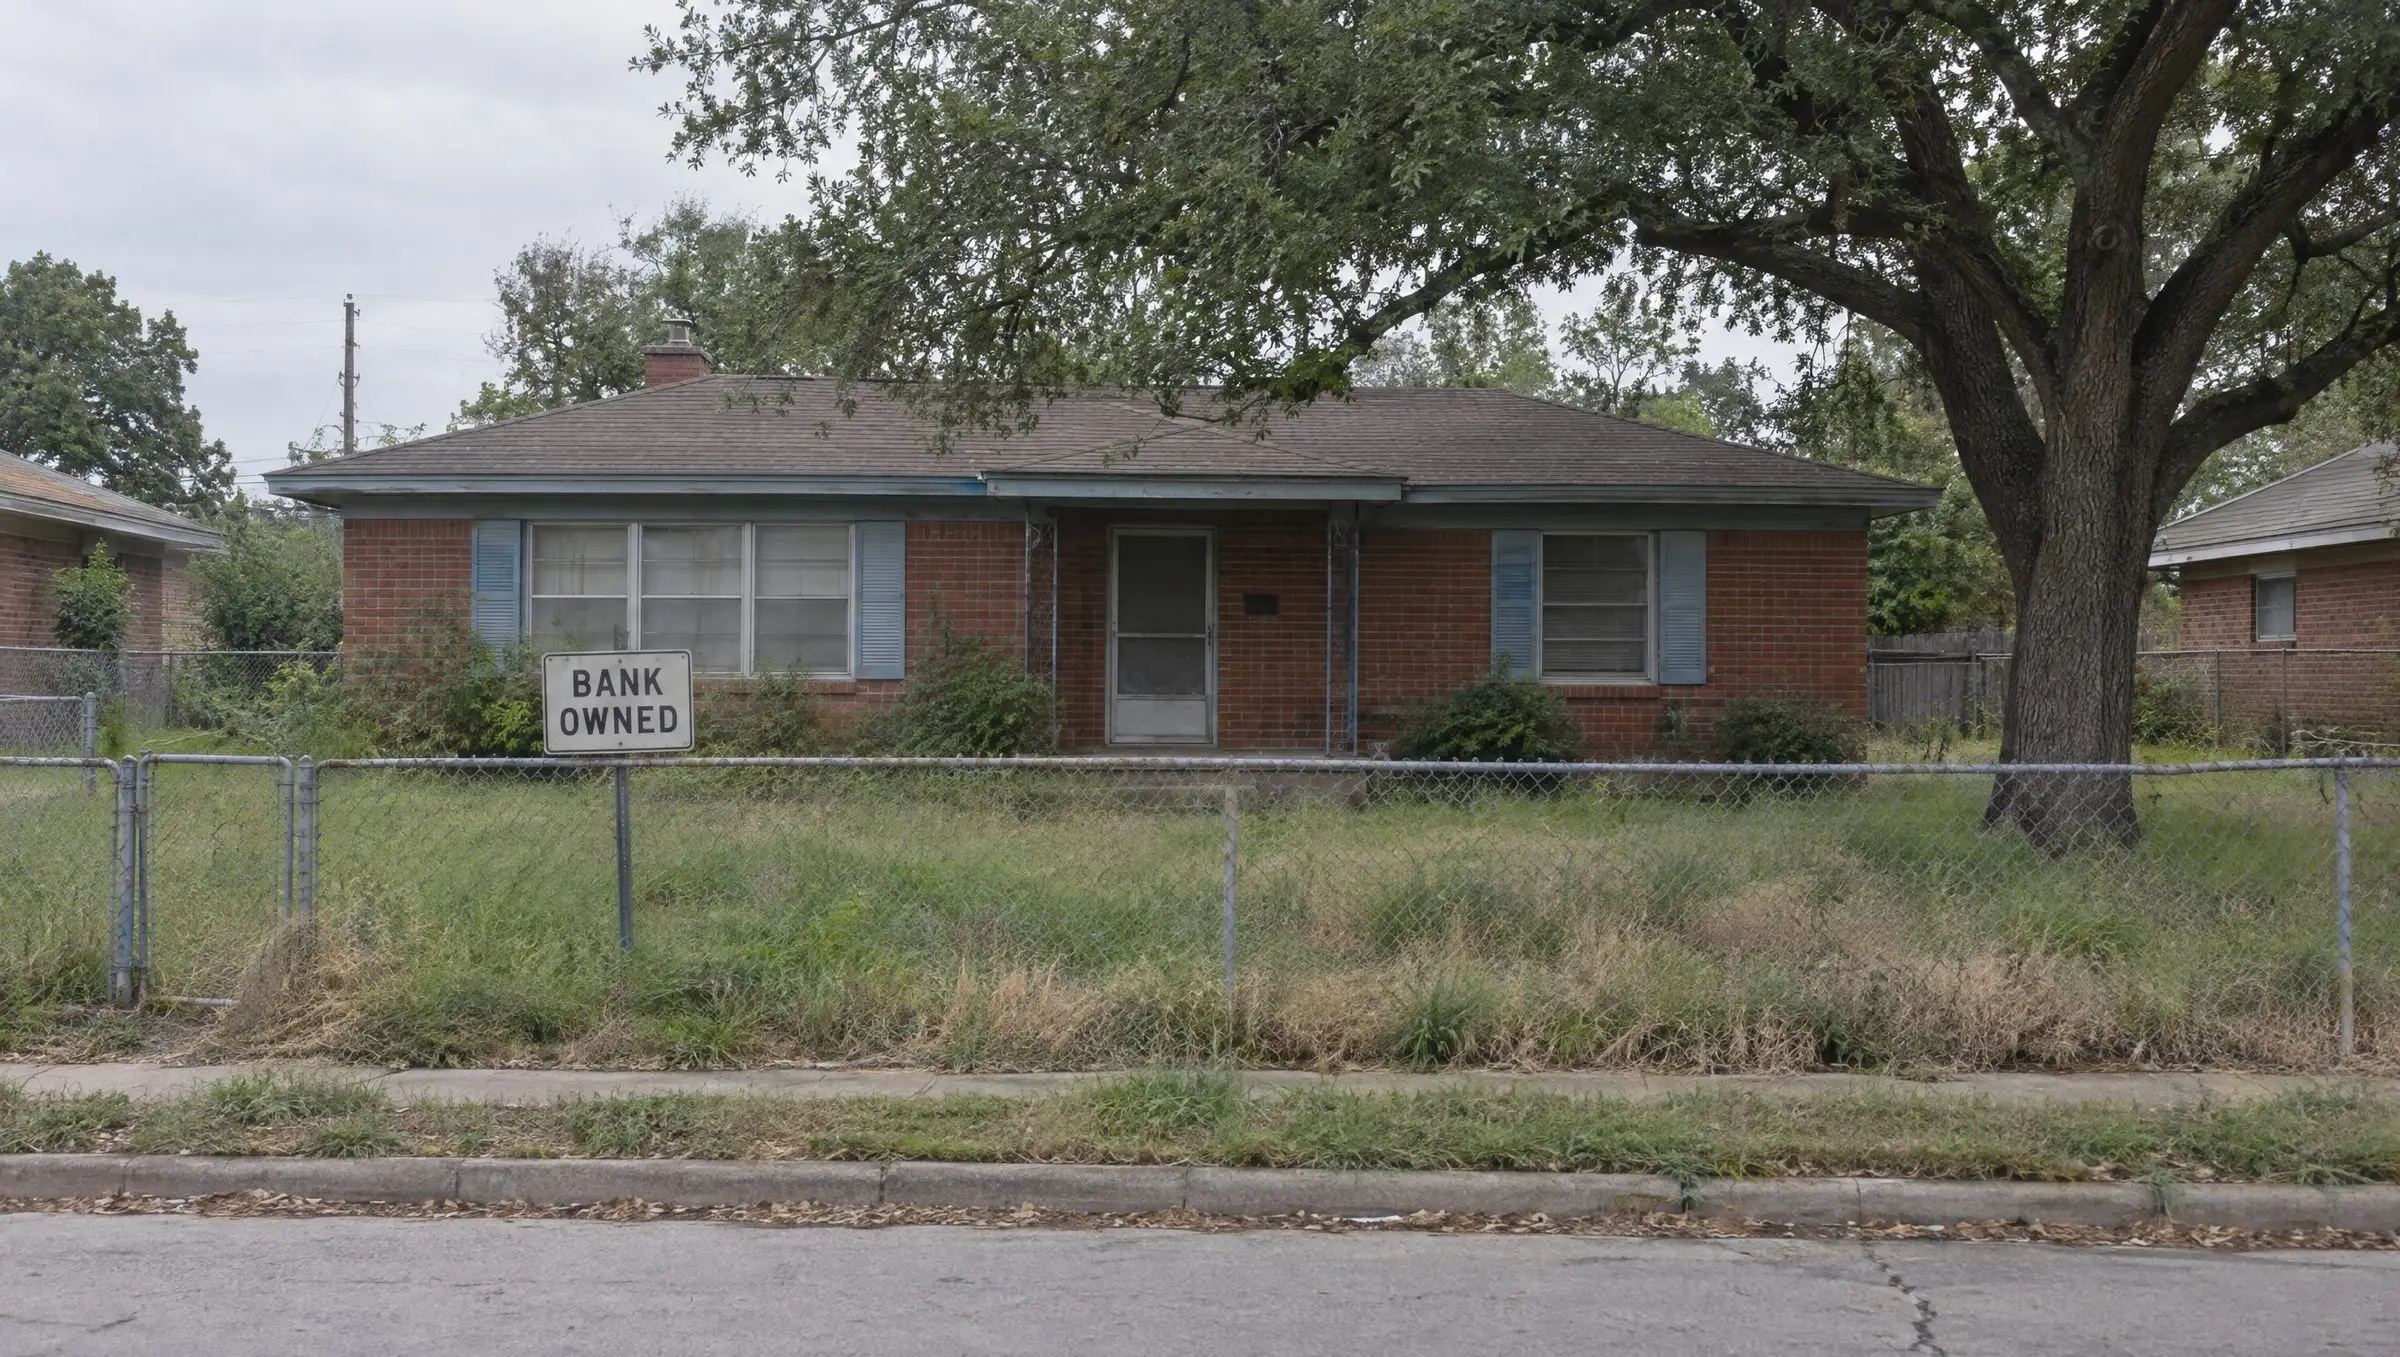

Top third of sale prices, first half of 2009
- Median sale price
- $268,000
- Bank-owned sales
- 11.0%
- Cash purchases
- 9%
- Sale to original list
- 94.5%
- Conventional loans
- 67%
Bottom third of sale prices, first half of 2009
- Median sale price
- $57,000
- Bank-owned sales
- 70.9%
- Cash purchases
- 55%
- Sale to original list
- 90.2%
- Conventional loans
- 22%
Thirds of all closed sale prices in each quarter, January to June 2009. AI-generated illustrations (Higgsfield) of a bank-owned ranch house and an established high-priced street, not photographs of specific homes.
Sale terms gave way at the bottom before prices did
Prices in a repeat-sales index move slowly because they only register when the same house sells twice. Sale terms move faster. In both eras the low tier's terms weakened a year or more before its price index showed a decline. The panels below use thirds of all closed sale prices in each quarter. Switch between eras; the scales stay fixed so the two can be compared directly.
- High tier
- Mid tier
- Low tier
The last point in the 2020 to 2026 panels covers July to September 2026 only. Bank-owned and short-sale flags come from the listing's special conditions field.
In the first half of 2005, low-tier homes sold for a median 97.1% of their original asking price, the same as the other tiers. By the second half of 2006 the figure was 94.7% and 43% of low-tier sales had taken a price cut, against 96.4% and 38% in the top third. A year later it was 91.3%, and 52% of low-tier sales had been cut. Bank-owned homes were already 33% of low-tier sales in 2005; they reached 70.9% in the first half of 2009.
The current era has followed the same order. Low-tier homes sold above asking in the first half of 2022, at a median 102.4% of original list. By the second half of 2025 the figure was 94.2% and 51% of low-tier sales had taken a cut, against 95.8% and 42% in the top third. Those readings sit between where the last cycle stood in late 2006 and late 2007. The bank-owned share is the reading that does not match: 3.4% of low-tier sales in the first half of 2026, up from 0.3% in 2021 but a fraction of the 2005 level.
Financing moved down the price ladder in both eras, for different reasons. In 2008 and 2009, when subprime and other nonconforming loans disappeared, FHA went from 14% to 58% of mid-tier purchases within two years. In the current era FHA's share of mid-tier purchases rose from 8% in the first half of 2022 to 28% in the first half of 2026, as cash and conventional buyers who outbid everyone in 2021 and 2022 pulled back.
Adjusted for inflation, the bottom third has lost ground since 2020
Consumer prices rose 28% from the fourth quarter of 2020 to the third quarter of 2026. The dotted line on the nominal chart shows where a house would need to be to keep pace. The low tier's lead over that line narrowed every year after 2022 and was gone by Q1 2026. Switch to the adjusted view to see each tier in late-2020 dollars.
End labels are averages of the last two quarters. Inflation: CPI-U, all items, seasonally adjusted, quarterly averages.
In late-2020 dollars, the high tier has gained about 16%, the mid tier about 1%, and the low tier has lost about 4%. An owner who bought a low-tier home in late 2020 has more dollars of value today and less purchasing power in that value than at purchase. An owner who bought in mid-2022 has neither.
The FHFA zip index does not yet show the current split. From 2021 to 2025 it rose 31% in the lowest-priced third of Dallas County zips and 34% in the highest.3 That index tracks only conventional loans bought by Fannie Mae and Freddie Mac, and only through 2025. The bottom-tier sales in our data increasingly use FHA financing or seller concessions, which the FHFA series does not capture.
Foreclosures drove the last split; carrying costs and credit drive this one
The two eras share an order of events and very little else underneath. Each row compares the most extreme half-year of the earlier period with the most extreme half-year of the current one.
Bank-owned share of low-tier sales
2009 H170.9%2026 H13.4%Highest half-year in each eraCash share of low-tier purchases
2010 H264.4%2025 H228.1%Highest half-year; current era from 2023Low-tier sales with seller concessions
2010 H218.2%2026 H154.9%2008 to 2012 low point against the current highNew construction share of mid-tier sales
2012 H23.7%2025 H119.4%2008 to 2012 low point against the current highFHA share of mid-tier purchases
2009 H261.0%2025 H228.0%Highest half-year in each era
In the last cycle, distressed sales set prices at the bottom. A third of low-tier sales were already bank-owned in 2004 and 2005, before the national downturn, and the share reached 70.9% in the first half of 2009. Investors buying with cash took most of that supply. Builders all but stopped selling in the bottom two tiers.
Mortgage underwriting is the main reason the current era looks different. The Consumer Financial Protection Bureau's ability-to-repay rule took effect in January 2014 and requires lenders to verify income and assets.4 The Freddie Mac 30-year average stayed between 2.65% and 3.18% through 2021, the year Dallas County closed 22,501 single-family sales in our data, and owners who bought or refinanced then hold fixed rates less than half of today's.5 Owners with equity who hit trouble can usually sell before a lender forecloses, which keeps bank-owned supply low.
Pressure on low-tier buyers in this cycle comes from the cost of owning. The Freddie Mac 30-year rate averaged 7.32% in the week of Oct. 22.5 Homeowners insurance and property taxes are not fixed by the mortgage. The Federal Reserve Bank of Dallas found that the median Texas homeowner paid about 60% more for insurance in 2024 than in 2019, about double the national increase, and named Dallas-Fort Worth among the Texas metros with the highest insurance burden.6 Freddie Mac found that very-low-income borrowers spent 3.1% of monthly income on homeowners insurance in 2023, against 1.1% for high-income borrowers.7 Builders compete for the same buyers: new homes were nearly a fifth of mid-tier sales in 2025, often sold with rate buydowns and concessions. Sellers of existing homes have answered with concessions of their own, on more than half of low-tier sales in 2026.

AI-generated illustration of an insurance renewal and a property tax statement on a kitchen table (Higgsfield)
What the income and wealth data show
The split in home prices tracks a split in household balance sheets. In the second quarter of 2026 the bottom half of U.S. households held 0.6% of corporate equities and mutual fund shares and 9.7% of real estate, while the top 1% held 32.5% of all household net worth, according to the Federal Reserve's distributional accounts.8 For most households in the bottom half, the home is the main asset. Rising stock prices since 2020 have added to the down payments and cash purchases of buyers at the top of the price range and done little for buyers at the bottom. In our data, about a quarter of high-tier homes are bought with cash; in the 2004 to 2012 period the figure was about one in ten.
The income evidence is more mixed. From 2019 to 2023, real hourly wages rose 13.2% at the 10th percentile and 4.4% at the 90th, according to the Economic Policy Institute, which does not fit a simple account in which inflation hit the bottom hardest.9 The more direct squeeze on would-be buyers at the bottom is the price of entry: payment on a home bought at 7% rather than 3%, insurance and taxes on top, and a down payment saved while rents rose. The National Association of Realtors reported that first-time buyers made up 21% of purchases in its 2025 survey, the lowest share on record, at a median age of 40.10
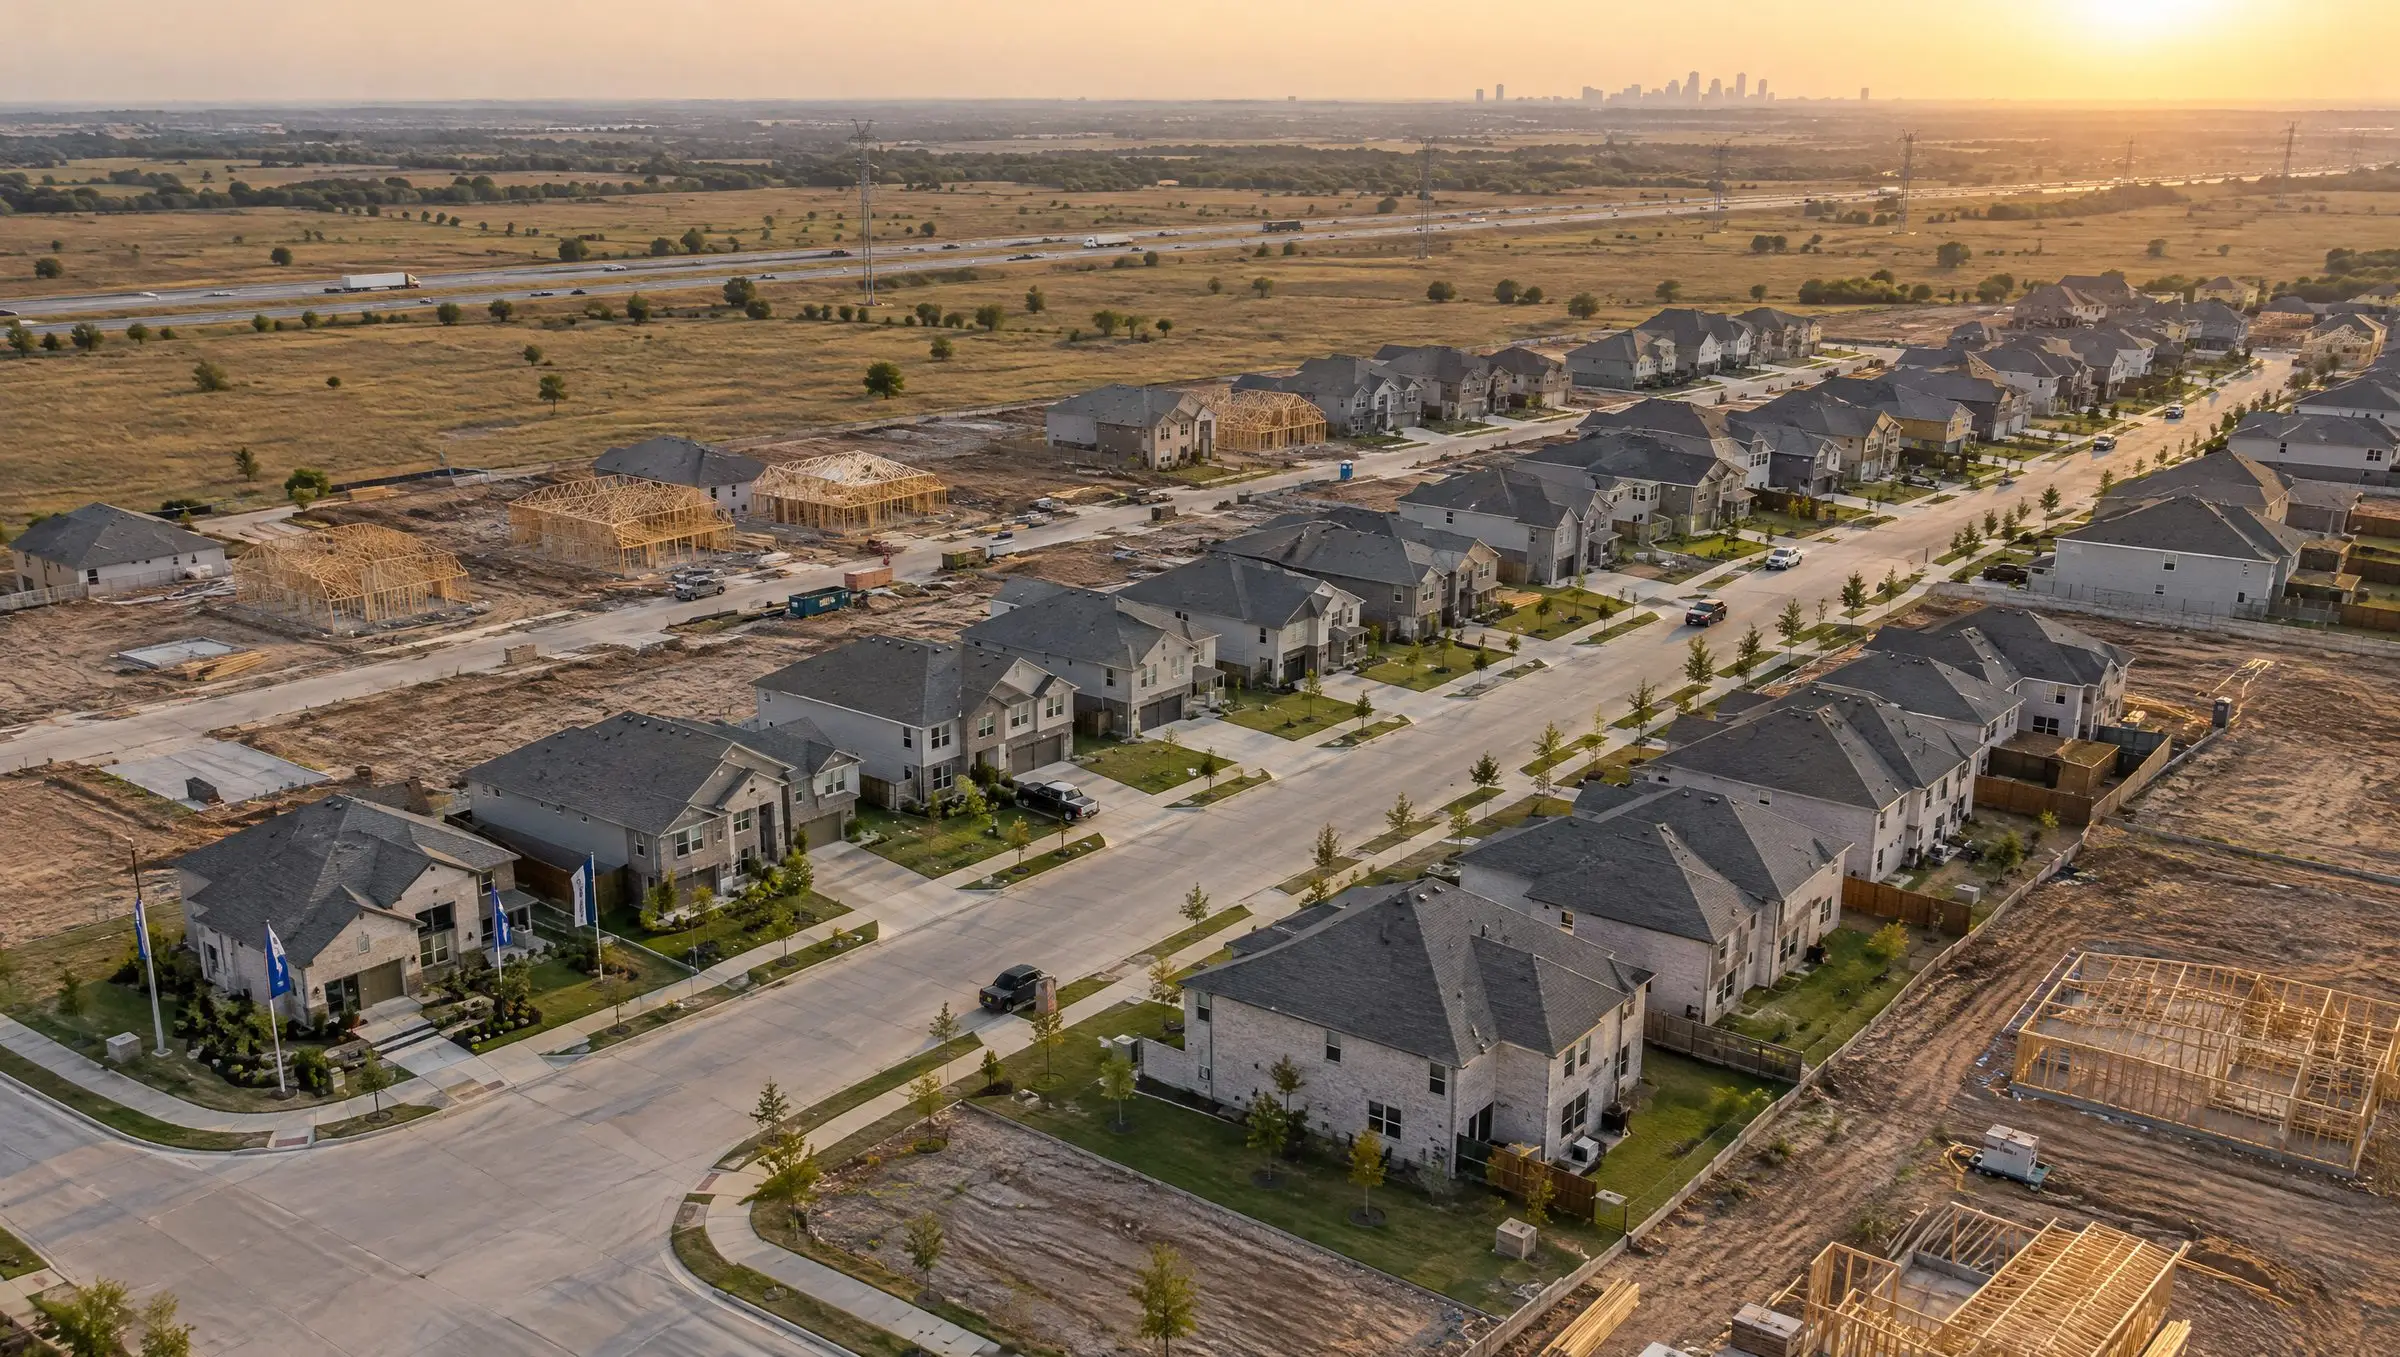
AI-generated aerial illustration of a new subdivision at the edge of Dallas-Fort Worth (Higgsfield)
An estimated 7,000 recent low-down-payment buyers would likely sell for less than they owe
We do not have loan data, so this is an estimate built from the sales records. For each FHA, VA and USDA purchase from January 2021 through June 2026 that has not been resold on the MLS, we assumed the program's minimum down payment with the upfront fee financed, a 30-year fixed rate at that month's Freddie Mac average, and scheduled payments since. We then marked the purchase price to the September 2026 level of its price tier's index. Individual homes scatter widely around an index, so rather than call each loan underwater or not, we used the spread the repeat-sales model measures between pairs of sales of the same house to estimate the probability that each home would sell today for less than the loan balance. Added up across 18,697 purchases, the expected number is 7,035, or 38%. Buyers who put down more than the program minimum owe less than the model assumes, so the figure is closer to a ceiling than a central estimate.
Low tier
43%about 3,931 of 9,227 purchasesStarting from the price net of seller concessions: 46%Mid tier
34%about 2,736 of 8,132 purchasesStarting from the price net of seller concessions: 38%High tier
28%about 368 of 1,338 purchasesStarting from the price net of seller concessions: 30%- Low tier
- Mid tier
- High tier
Balance: program minimum down payment (FHA 3.5% plus 1.75% upfront premium; VA no down payment plus funding fee; USDA no down payment plus 1% fee), scheduled amortization at the Freddie Mac average rate for the month of purchase. Value: purchase price times the change in the purchase's price tier index, with house-level spread taken from the repeat-sales model. These are expected shares across many loans, not a reading on any single home.
The last bar includes every estimate of 125% or more. About 1% of low-tier estimates exceed 150%; those come from the widest house-level spreads and are the least reliable.
An FHA loan starts at about 98% of the purchase price once the upfront premium is financed, and a VA loan with the funding fee financed starts above 100%, so a recent buyer in either program has little room for a price decline or for an unlucky sale. The tier's direction decides how much worse it gets. In the low tier 43% of purchases, about 3,900 homes, are expected to sell for less than the balance, against 34% in the mid tier and 28% in the high tier. Low-tier buyers from 2023 and 2024 are the most exposed, at 57% and 56%. Buyers from 2021 bought before the run-up ended and nearly all have equity.
Most underwater borrowers are close to even. Of the 7,049 low-tier purchases from 2022 onward, about 3,400 are expected to be above 100% loan-to-value and about 1,700 above 110%. That is a smaller hole than in 2009. It still matters, because a borrower without equity cannot sell to pay off the loan. Selling costs in Dallas County, with commissions and the concessions now common at the bottom of the market, run to roughly 8% of price. Counting those costs, about 69% of 2023 buyers and 71% of 2024 buyers would need to bring cash to closing, so a job loss, divorce or move can become a short sale, a loss-mitigation case or a foreclosure.
Try a scenario
The price change applies on top of today's estimate. At 0% selling costs the result is the expected share underwater; raise the selling costs to see how many would need cash to sell.
- Low tier
- 43%about 3,930 homes
- Mid tier
- 34%about 2,740 homes
- High tier
- 28%about 370 homes
In 2009 cash investors set a floor; today that buyer is missing
A falling market stops falling when someone is willing to buy at the lower price. In the last cycle that buyer was an investor paying cash for bank-owned homes. Cash purchases went from 16% of low-tier sales in 2005 to 64% in the second half of 2010, and bank-owned homes were most of what they bought.
- 2005 to 2012
- 2022 to 2026
- 2005 to 2012
- 2022 to 2026
In this cycle the low-tier cash share peaked at 35% in the first half of 2022 and has held near 25% since. Few homes are coming to market through foreclosure, so there is little deeply discounted supply to attract that capital, and Dallas County rents had stopped rising in our October analysis, which narrows an investor's margin on a home bought to rent. Builders in the southern and eastern parts of the county were selling near resale prices with concessions, competing with a low-tier resale for the same household.
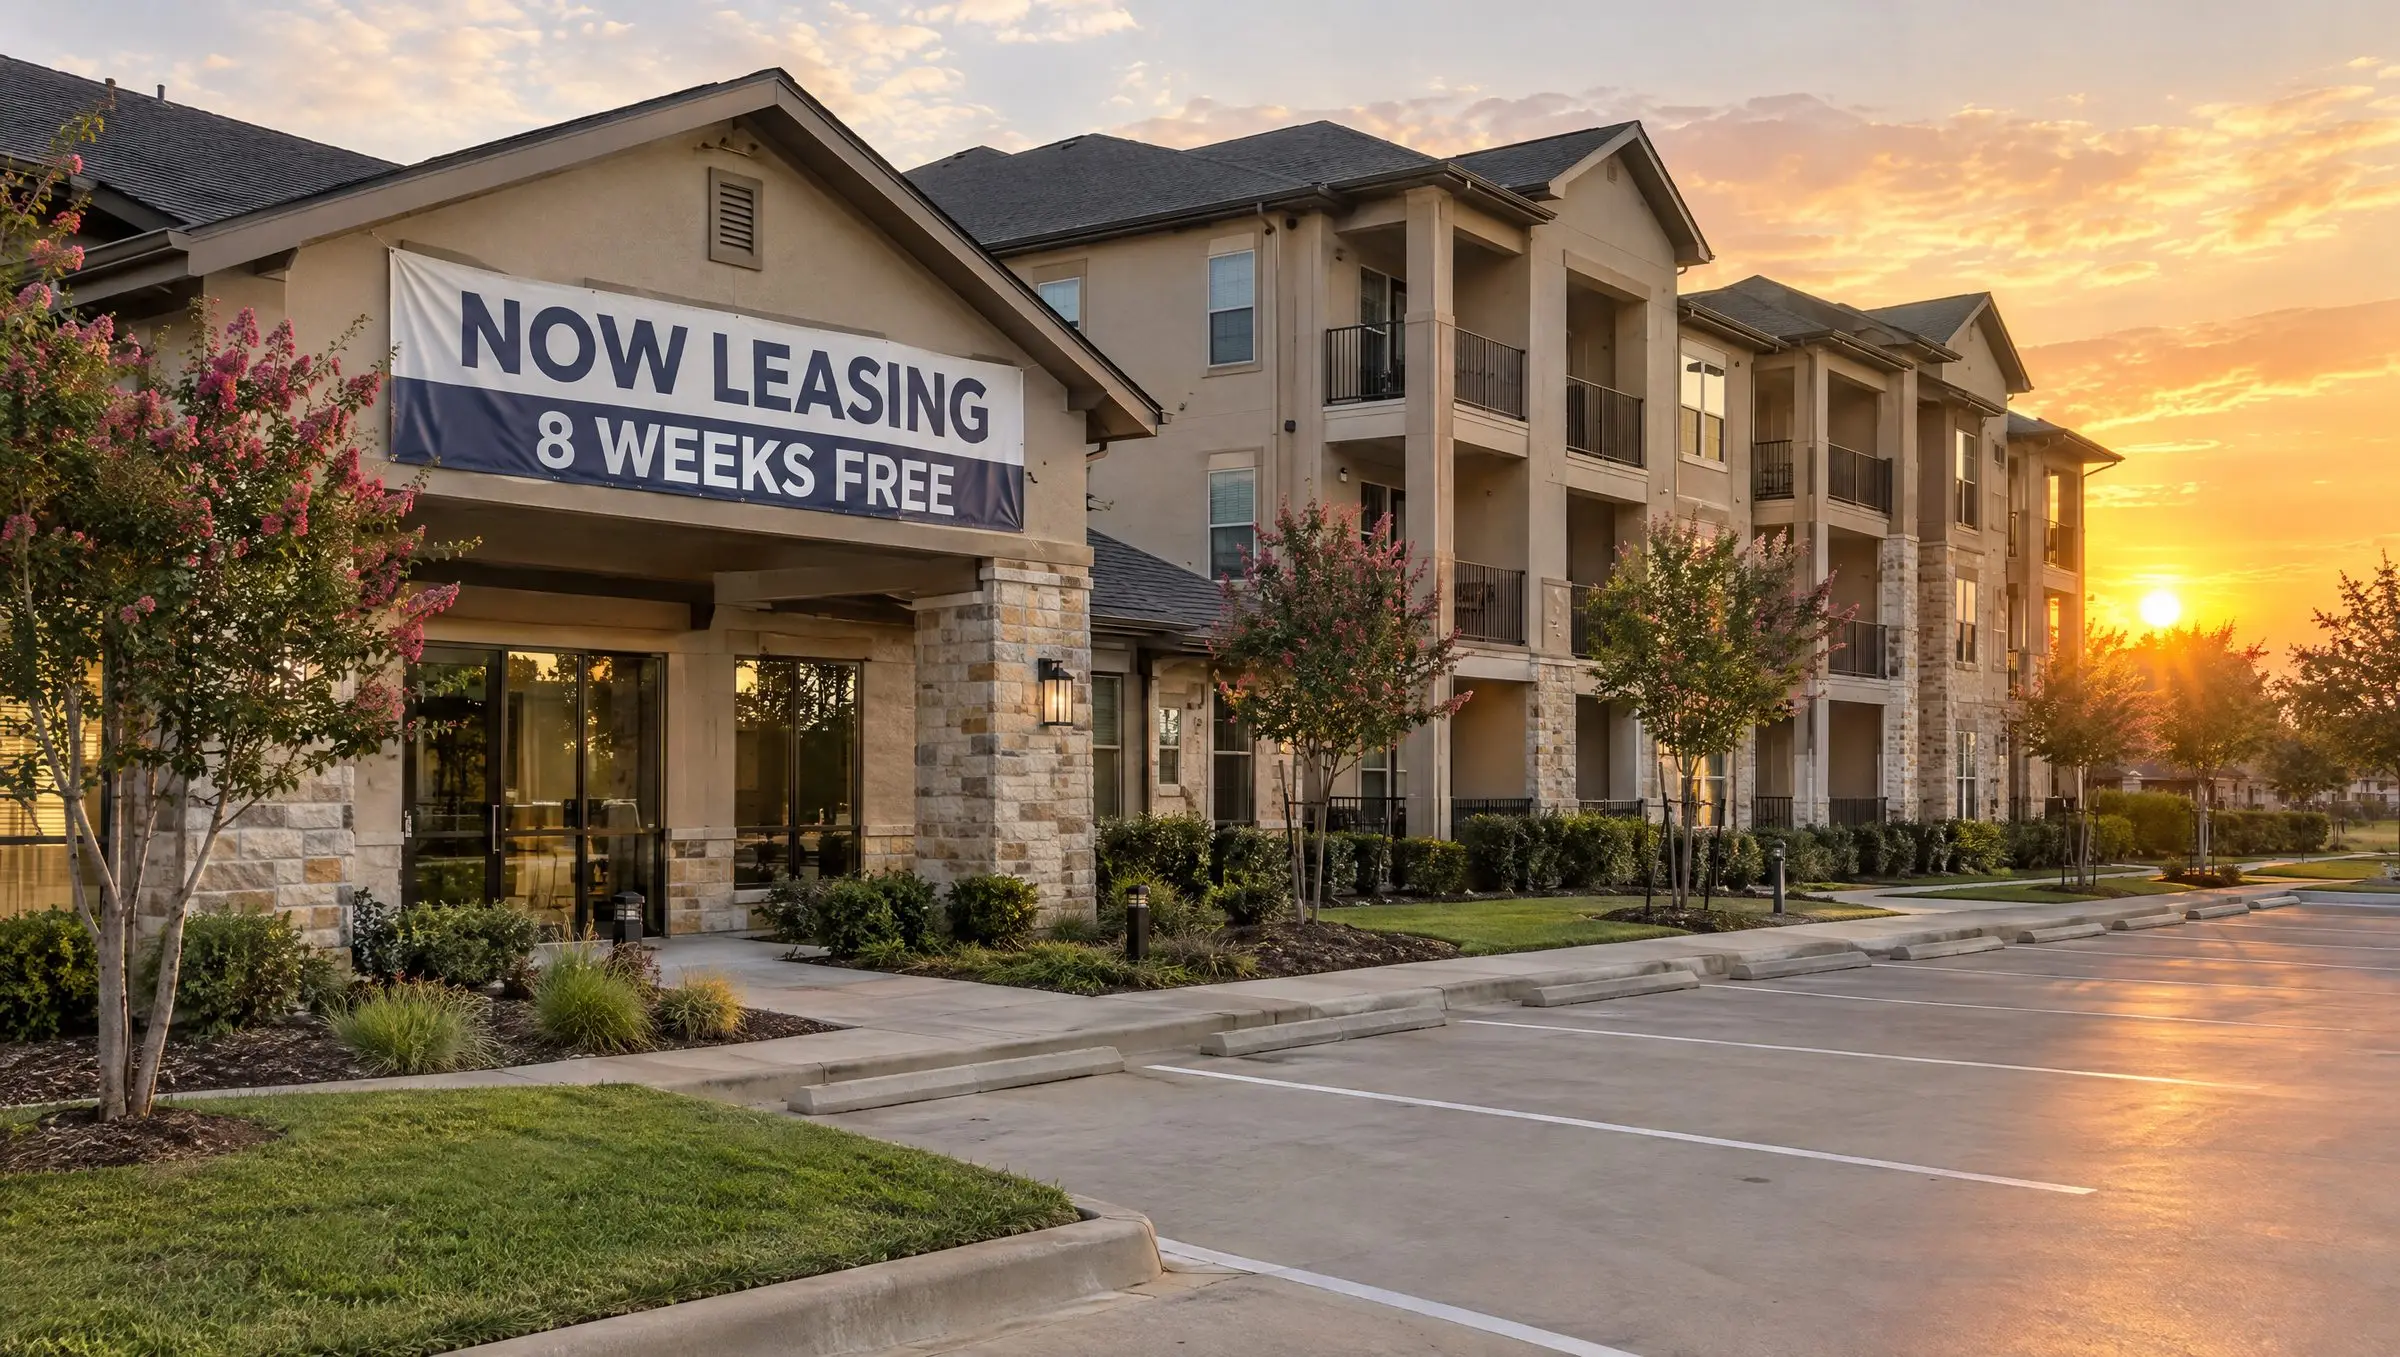
AI-generated illustration of a suburban Dallas apartment complex advertising free rent (Higgsfield)
Without a wave of forced sales, the likelier path is a long, slow decline at the bottom
The 2005 split became a crash in the low tier because foreclosures put a steady stream of homes on the market at whatever price cleared them. Today's owners mostly have fixed-rate loans with verified income behind them, and the bank-owned share of sales is a small fraction of what it was. That makes a repeat of 2008 to 2011 in the bottom tier unlikely without a large rise in unemployment.
Sellers who need to move cut their price or pay the buyer's costs. Owners who do not need to move stay put. Fewer homes trade, and those that do clear a little lower each year, in nominal or in real terms. The high tier in the last cycle shows what that looks like over a long stretch: it ended 2012 about 5 points above its early-2005 level in nominal terms and 11% below its 2004 value after inflation, with no crash along the way.
If employment holds
- Low-tier prices drift sideways to lower in nominal terms and fall further in real terms.
- Concessions and price cuts stay high; bank-owned sales rise slowly from a low base.
- Recent FHA and VA buyers with no equity stay in place, and their mobility falls.
- The county average looks flat while the gap between the tiers keeps widening.
If unemployment rises
- Owners without equity who lose income have no sale that pays off the loan.
- Delinquency concentrates in 2023 to 2025 FHA and VA purchases in the bottom tier.
- Bank-owned and short sales grow in the southern and eastern zips where those loans sit.
- Without a cash buyer at the bottom, prices fall until renting the home out pays again.
Where losses would land
The losses from a slow slide fall on different parties than in 2008, when banks and private mortgage securities absorbed much of the damage. FHA loans are insured by the government through FHA's Mutual Mortgage Insurance Fund, and VA loans are partly guaranteed; the Mortgage Bankers Association put the FHA delinquency rate at 11.79% in the second quarter of 2026, against 2.72% for conventional loans.11 ICE reported early this year that FHA loans accounted for about 80% of the rise in seriously delinquent and foreclosed mortgages, and FHA's pandemic-era loss mitigation options expired on Sept. 30, 2025.1213 Builders carry the cost of the buydowns and concessions they use to keep selling. Texas counties, cities and school districts depend on property taxes set from appraised values, so a long decline at the bottom of the market shows up in their budgets. Owners in the bottom tier, whose home is often most of what they own, lose the equity they would have used to trade up, retire or weather an emergency.
The bottom-tier zips with the most FHA, VA and USDA purchases from 2023 onward, in low and mid tiers combined, are 75149 (628), 75115 (597), 75181 (586), 75241 (557), 75043 (547), 75216 (532). They are in Mesquite, DeSoto, Garland and southern Dallas. The equity estimate is not marked zip by zip, so these counts show where the loans are, not which zips have fallen most. They are loan-volume counts, not a risk ranking of neighborhoods, and they are no basis for deciding where to lend or how to price a loan.
The readings that warned early last time, and where they stand
The practical question from the top of this piece was which early readings warned of trouble in the low tier, and where they stand now. Each row gives a reading from the first half of 2005 (when the low tier peaked), the second half of 2006 (when its terms had clearly turned), the worst half-year of 2007 to 2009, and the first half of 2026. All are available to anyone with MLS access and can be run for a single county, city or zip.
| Reading | 2005 H1 | 2006 H2 | Extreme, 2007 to 2009 | 2026 H1 | Note |
|---|---|---|---|---|---|
| Low tier: sale price to original list | 97.1% | 94.7% | 90.1% (2008 H1) | 95.8% | Fell first in both eras |
| Low tier: sales after a price cut | 34% | 43% | 52% (2007 H2) | 43% | At the late-2006 level today |
| Low tier: bank-owned share of sales | 32.6% | 38.3% | 70.9% (2009 H1) | 3.4% | Small, but up each year since 2023 |
| Low tier: cash purchases | 16% | 20% | 55% (2009 H1) | 25% | The bust-era floor; not rising now |
| Mid tier: FHA purchases | 15% | 11% | 61% (2009 H2) | 28% | Financing moves down-market |
| Low tier: seller concessions | 44% | 43% | 22% (2009 H1) | 55% | Highest of either era |
- 01Time-adjust by tier, not by county
In both cycles the county index hid opposite movements. A low-tier comparable from 2022 may need a downward time adjustment while a high-tier one from the same quarter needs an upward one.
See the data - 02Treat concessions as price
More than half of low-tier sales in 2026 included seller-paid costs. A contract price with a concession is not the same evidence as one without.
See the data - 03Segment the portfolio by vintage and tier
FHA and VA purchases from 2023 to 2025 in the bottom tier carry the least equity. Mark them to a tier index rather than a county index.
See the data - 04Watch bank-owned share in the bottom tier
It was the bridge from a tier split to a county decline in 2007. It is small today and has risen each year since 2023.
See the data - 05Track who is buying at the bottom
A rising cash share in the low tier would signal that investors see value again. It has not risen.
See the data - 06Report in real terms as well
A home that held its nominal price since mid-2022 has lost about 13% of its value against consumer prices.
See the data
Data: aggregates from MLS exports of Dallas County single-family sales. 186,738 closed sales from Jan. 1, 2004 through Dec. 31, 2012; 110,191 from Oct. 26, 2020 through Sep. 30, 2026. No addresses, listing numbers or individual sales are published. Images are AI-generated illustrations made with Higgsfield and do not show specific properties. Research checked Oct. 25, 2026. General information, not lending, legal or investment advice.
Methods and known limits
- Repeat-sales index: consecutive closed sales of the same property at least 180 days apart, linked by zip, street number and normalized street name. Builder sales, bank-owned or investor-language first sales, renovation language on the second listing, and changes of more than 10% in living area or more than two years in year built are excluded. Fit on quarterly terms with Case-Shiller style weighting by holding period. Tiers are thirds of the first sale's price within its quarter. The 2020 to 2026 index reproduces the one published in our October analysis exactly; the 2004 to 2012 index uses the same code and filters. Second sales can be bank-owned, so the earlier index includes foreclosure discounts.
- Aligned comparison: each tier's index divided by its value in the quarter the low tier peaked (Q1 2005; Q2 2022). The gap is the ratio of the high tier's change to the low tier's change, minus one.
- Sale terms by tier: thirds of all closed sale prices within each quarter. Financing, bank-owned, short sale and builder flags come from the listing's buyer financing and special conditions fields.
- Equity estimate: FHA (including 203(b)), VA, Texas Vet and USDA purchases closed January 2021 to June 2026 and not resold on the MLS by September 2026. Loan: FHA 96.5% of price plus a 1.75% upfront premium; VA 100% plus a 2.3% (before April 7, 2023) or 2.15% funding fee; USDA 100% plus 1%. Rate: Freddie Mac 30-year average for the month of purchase. Scheduled amortization only, no prepayment, modification or partial claim. Value: price times the change in the tier index from the purchase quarter (three-quarter centered mean) to April to September 2026 (two-quarter mean). House-level spread: the repeat-sales model's residual variance for that tier, as a function of days held, gives a normal spread in log value around the index estimate; each loan's probability of a sale below its balance is summed for the expected counts. The scenario calculator and histogram use 40 simulated draws per loan. Concession-adjusted figures subtract seller-paid costs up to 10% of price from the starting value. Refinances, second liens, loss-mitigation balances and sales outside the MLS are not observed.
- FHFA check: FHFA annual ZIP5 all-transactions index (developmental), Dallas County zips with 40 or more MLS sales in the base year and an FHFA value every year, grouped into thirds by median MLS sale price in 2004 or 2021, weighted by sales.
- Inflation: CPI-U, all items, seasonally adjusted, quarterly averages, from FRED.
Sources
- S&P CoreLogic Case-Shiller TX-Dallas Home Price Index (DAXRNSA) and U.S. National Home Price Index (CSUSHPINSA), via FRED
- Federal Reserve Bank of Dallas, Southwest Economy, 2013, on Texas home equity lending limits
- Federal Housing Finance Agency, House Price Index for five-digit ZIP codes, all-transactions, annual (developmental), last updated March 31, 2026
- Consumer Financial Protection Bureau, Regulation Z, 12 CFR 1026.43, minimum standards for transactions secured by a dwelling (ability to repay), effective Jan. 10, 2014
- Freddie Mac, 30-Year Fixed Rate Mortgage Average in the United States (MORTGAGE30US), via FRED, weekly through Oct. 22, 2026
- Federal Reserve Bank of Dallas, Texas homeowners pay high insurance costs, face rising premiums, April 15, 2026
- Freddie Mac, The Cost of Homeowners' Insurance, March 20, 2024
- Board of Governors of the Federal Reserve System, Distributional Financial Accounts, second quarter of 2026, released Sept. 18, 2026
- Economic Policy Institute, State of Working America Wages 2023 (corrected figures)
- National Association of Realtors, First-Time Home Buyer Share Falls to Historic Low of 21%; Median Age Rises to 40, Nov. 4, 2025
- Mortgage Bankers Association, Mortgage Delinquencies Decrease Slightly in the Second Quarter of 2026, Aug. 13, 2026
- ICE, First Look at mortgage performance, January 2026 data
- U.S. Department of Housing and Urban Development, Mortgagee Letter 2025-12, April 15, 2025
- U.S. Bureau of Labor Statistics, Consumer Price Index for All Urban Consumers: All Items (CPIAUCSL), via FRED
The Signal / Twice-monthly briefing
Follow valuation policy, collateral risk and property technology, with sources.
Unsubscribe in one click. We don't sell your email or share it with sponsors. Privacy Policy