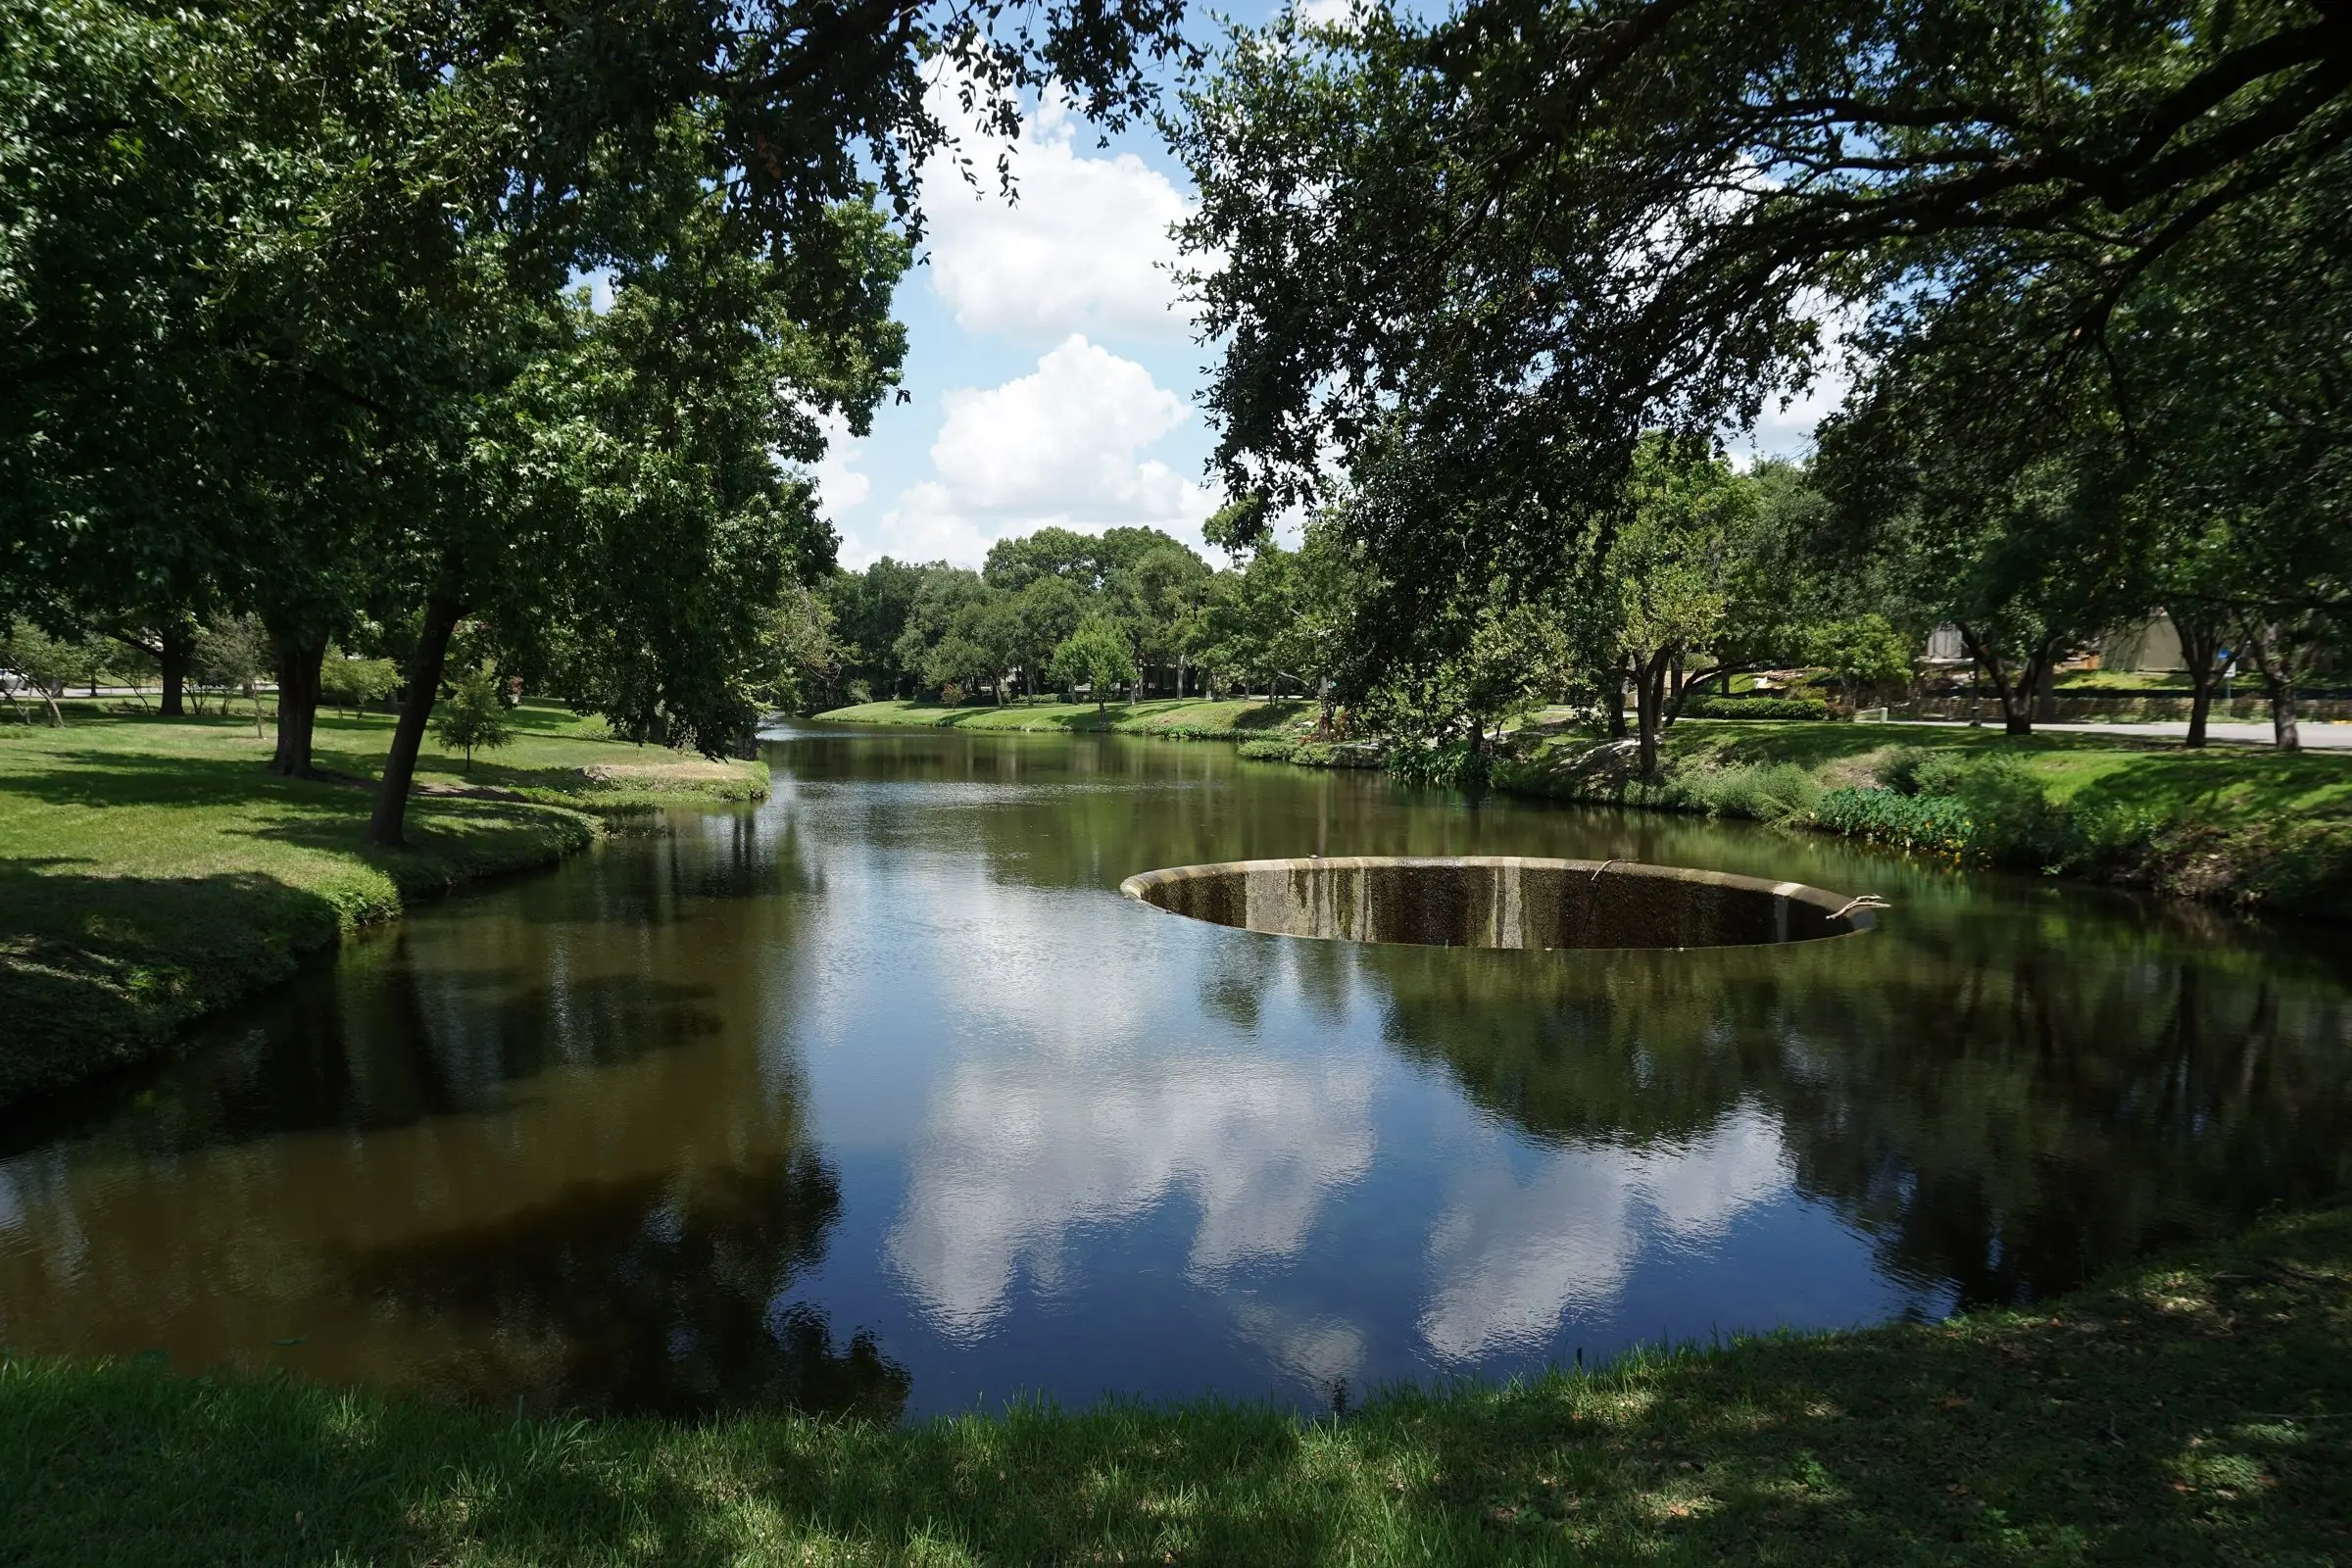
The Signal / Market analysis / October 24, 2026
Highland Park, mappedTwenty-two years of sales in one Texas town, analyzed and drawn the way an appraisal could present its market
2,882 closed single-family sales from an MLS export, geocoded, modeled and turned into heat maps, a quality-adjusted price index, street rankings and a value-driver model, written for appraisers and collateral risk professionals.
- Closed sales
- 2,882
- Median price per sq ft
- $322 $841
- Cash buyers, 2026
- 54%
Key points
- The study runs 2,882 closed single-family sales in Highland Park, Texas, from December 2004 through October 14, 2026, through a quality-adjusted price index. A same-quality home that sold for $1 million in 2005 would sell for about $2.85 million in 2026.
- Within 150 meters of the Turtle Creek, Exall Lake and Lakeside Park corridor, sales carried a 15% price premium. Highland Park's Dallas ISD section sold for 21% to 24% less than equivalent homes in the Highland Park ISD section, holding house size and age constant.
- About 71% of a typical 2023 to 2026 sale price is land, based on 183 teardown sales since 2005. Teardown land prices rose from about $100 per lot square foot in 2005 and 2006 to $235 to $272 per square foot in 2022 to 2024.
- Cash buyers rose from 13.2% of sales in 2005 to 53.7% in 2026. As of October 14, 2026, the town had 28 active listings with a median asking price 64% above the $3.9 million median for homes that closed in the prior 12 months, representing 4.1 months of supply.
The Town of Highland Park covers about 2.2 square miles north of downtown Dallas. An MLS export of every single-family listing recorded there since December 2004 holds 3,248 records and 2,882 closed sales. A same-quality home that sold for $1 million in 2005 would have sold for about $2.85 million in 2026.
This feature runs that export through the analysis an appraisal could carry: a quality-adjusted price index with confidence bands, heat maps of location value, a ranking of streets that holds house size and age constant, a model of what drives price, and an estimate of how much of a typical sale is land. Each section explains the method and its limits, and each chart is drawn from the same data. It follows our Plano leading indicators feature and the Lake Ray Hubbard waterfront maps.
What the export holds and how it was prepared
The file has 94 columns per listing: price, dates, living area, lot size, year built, pool, stories, financing, days on market, list price history, school district and a free-text description. It has no coordinates. We sent each unique street address to the U.S. Census Bureau geocoder, which matched 2,788 of the 2,882 closed sales to a street location, then kept the 2,758 that fall inside the town limit on OpenStreetMap.
Lot size was blank on several hundred records; where the same parcel sold more than once, the missing lot size came from its other sales. Records with no living area or with obvious entry errors were left out of the models, which use 2,470 sales. The town's westernmost blocks are zoned to the Dallas Independent School District rather than Highland Park ISD; 441 mapped sales sit there, and the export's school district field separates them.
Every closed sale, year by year
- Sales that year
- 128
- Median price
- $1.23M
- Sales shown
- 0
Each glow is a 100 meter cell, brighter with more sales. Scroll to run the years, or use the slider.
Volume held between about 120 and 175 sales a year from 2005 through 2021 except for 2009. It fell to 73 in 2022 and has stayed below its earlier range since, while prices rose. Fewer sales means fewer recent comparables per block, which is one reason this article leans on models that use all 22 years of sales at once.
A same-quality home costs 2.85 times what it did in 2005
A median price mixes market change with changes in what sold. In Highland Park the homes that sell have grown larger and newer, so the median overstates appreciation. A hedonic index separates the two: a regression of log sale price on log living area, log lot size, new construction, age, pool, stories, school district, street and year. The year terms are the index, holding the house constant. A repeat-sales index, built from pairs of sales of the same unchanged house, gives a second estimate.
Hedonic model: 2,470 sales, R² 0.92. Repeat sales: same parcel, same year built, living area within 10%. Median price: all closed sales, rebased to 2005. Shaded column: 2020 to 2023.
Show the index values
| Year | Hedonic | 95% band | Repeat sales | Median price | Sales |
|---|---|---|---|---|---|
| 2005 | 100.0 | 82 to 122 | 100.0 | $1,225,000 | 129 |
| 2006 | 114.7 | 94 to 140 | 111.4 | $1,325,000 | 171 |
| 2007 | 124.3 | 102 to 152 | 119.0 | $1,323,000 | 145 |
| 2008 | 117.9 | 97 to 144 | 115.3 | $1,370,000 | 131 |
| 2009 | 99.9 | 82 to 122 | 101.3 | $1,225,000 | 81 |
| 2010 | 103.5 | 85 to 126 | 98.6 | $1,148,000 | 139 |
| 2011 | 103.4 | 85 to 126 | 102.0 | $1,125,000 | 143 |
| 2012 | 111.3 | 91 to 136 | 109.8 | $1,189,000 | 168 |
| 2013 | 121.9 | 100 to 149 | 117.2 | $1,450,000 | 131 |
| 2014 | 131.9 | 108 to 161 | 125.7 | $1,695,891 | 122 |
| 2015 | 137.5 | 112 to 168 | 133.3 | $1,370,000 | 121 |
| 2016 | 141.8 | 116 to 173 | 133.1 | $1,650,000 | 145 |
| 2017 | 137.7 | 113 to 168 | 133.7 | $1,725,500 | 144 |
| 2018 | 144.0 | 118 to 176 | 140.6 | $1,790,000 | 125 |
| 2019 | 140.9 | 115 to 172 | 139.4 | $1,880,000 | 127 |
| 2020 | 153.0 | 125 to 187 | 149.6 | $1,856,500 | 164 |
| 2021 | 176.7 | 145 to 216 | 173.3 | $2,340,078 | 146 |
| 2022 | 230.1 | 188 to 282 | 220.6 | $2,600,000 | 73 |
| 2023 | 254.6 | 208 to 311 | 238.9 | $3,100,000 | 83 |
| 2024 | 256.8 | 210 to 314 | 241.7 | $3,200,000 | 115 |
| 2025 | 270.3 | 221 to 331 | 249.7 | $3,350,000 | 83 |
| 2026 | 285.3 | 233 to 350 | 265.9 | $4,120,000 | 67 |
The index shows four periods. Prices rose to a 2007 peak, then fell 20% by 2009. They recovered through 2016 and moved sideways until 2019. From 2019 to 2023 the index rose 81%, and from 2023 to 2026 it added 12%. Across the 21 years the hedonic index averaged 5.1% a year.
The median sale price ended 2026 at 3.36 times its 2005 level, above the hedonic index's 2.85. The repeat-sales index, which follows unchanged houses as they age, ended lower at 2.66. The gap between the median line and the hedonic line is the part of a median-based time adjustment that comes from changes in what sold.
The price mix moved up
- Under $1M
- $1M to $2M
- $2M to $3M
- $3M to $5M
- $5M and up
Sales of $3 million and up rose from 10% of closings in 2005 to 19% in 2019 and 60% in 2026. Sales of $5 million and up went from 2% to 30%. Cash buyers, 13% of 2005 closings, made up 58% in 2021 and 54% in 2026. For collateral risk, a cash-heavy market produces fewer appraisals, so the appraisals that are ordered draw on a thinner record of recent appraised sales.
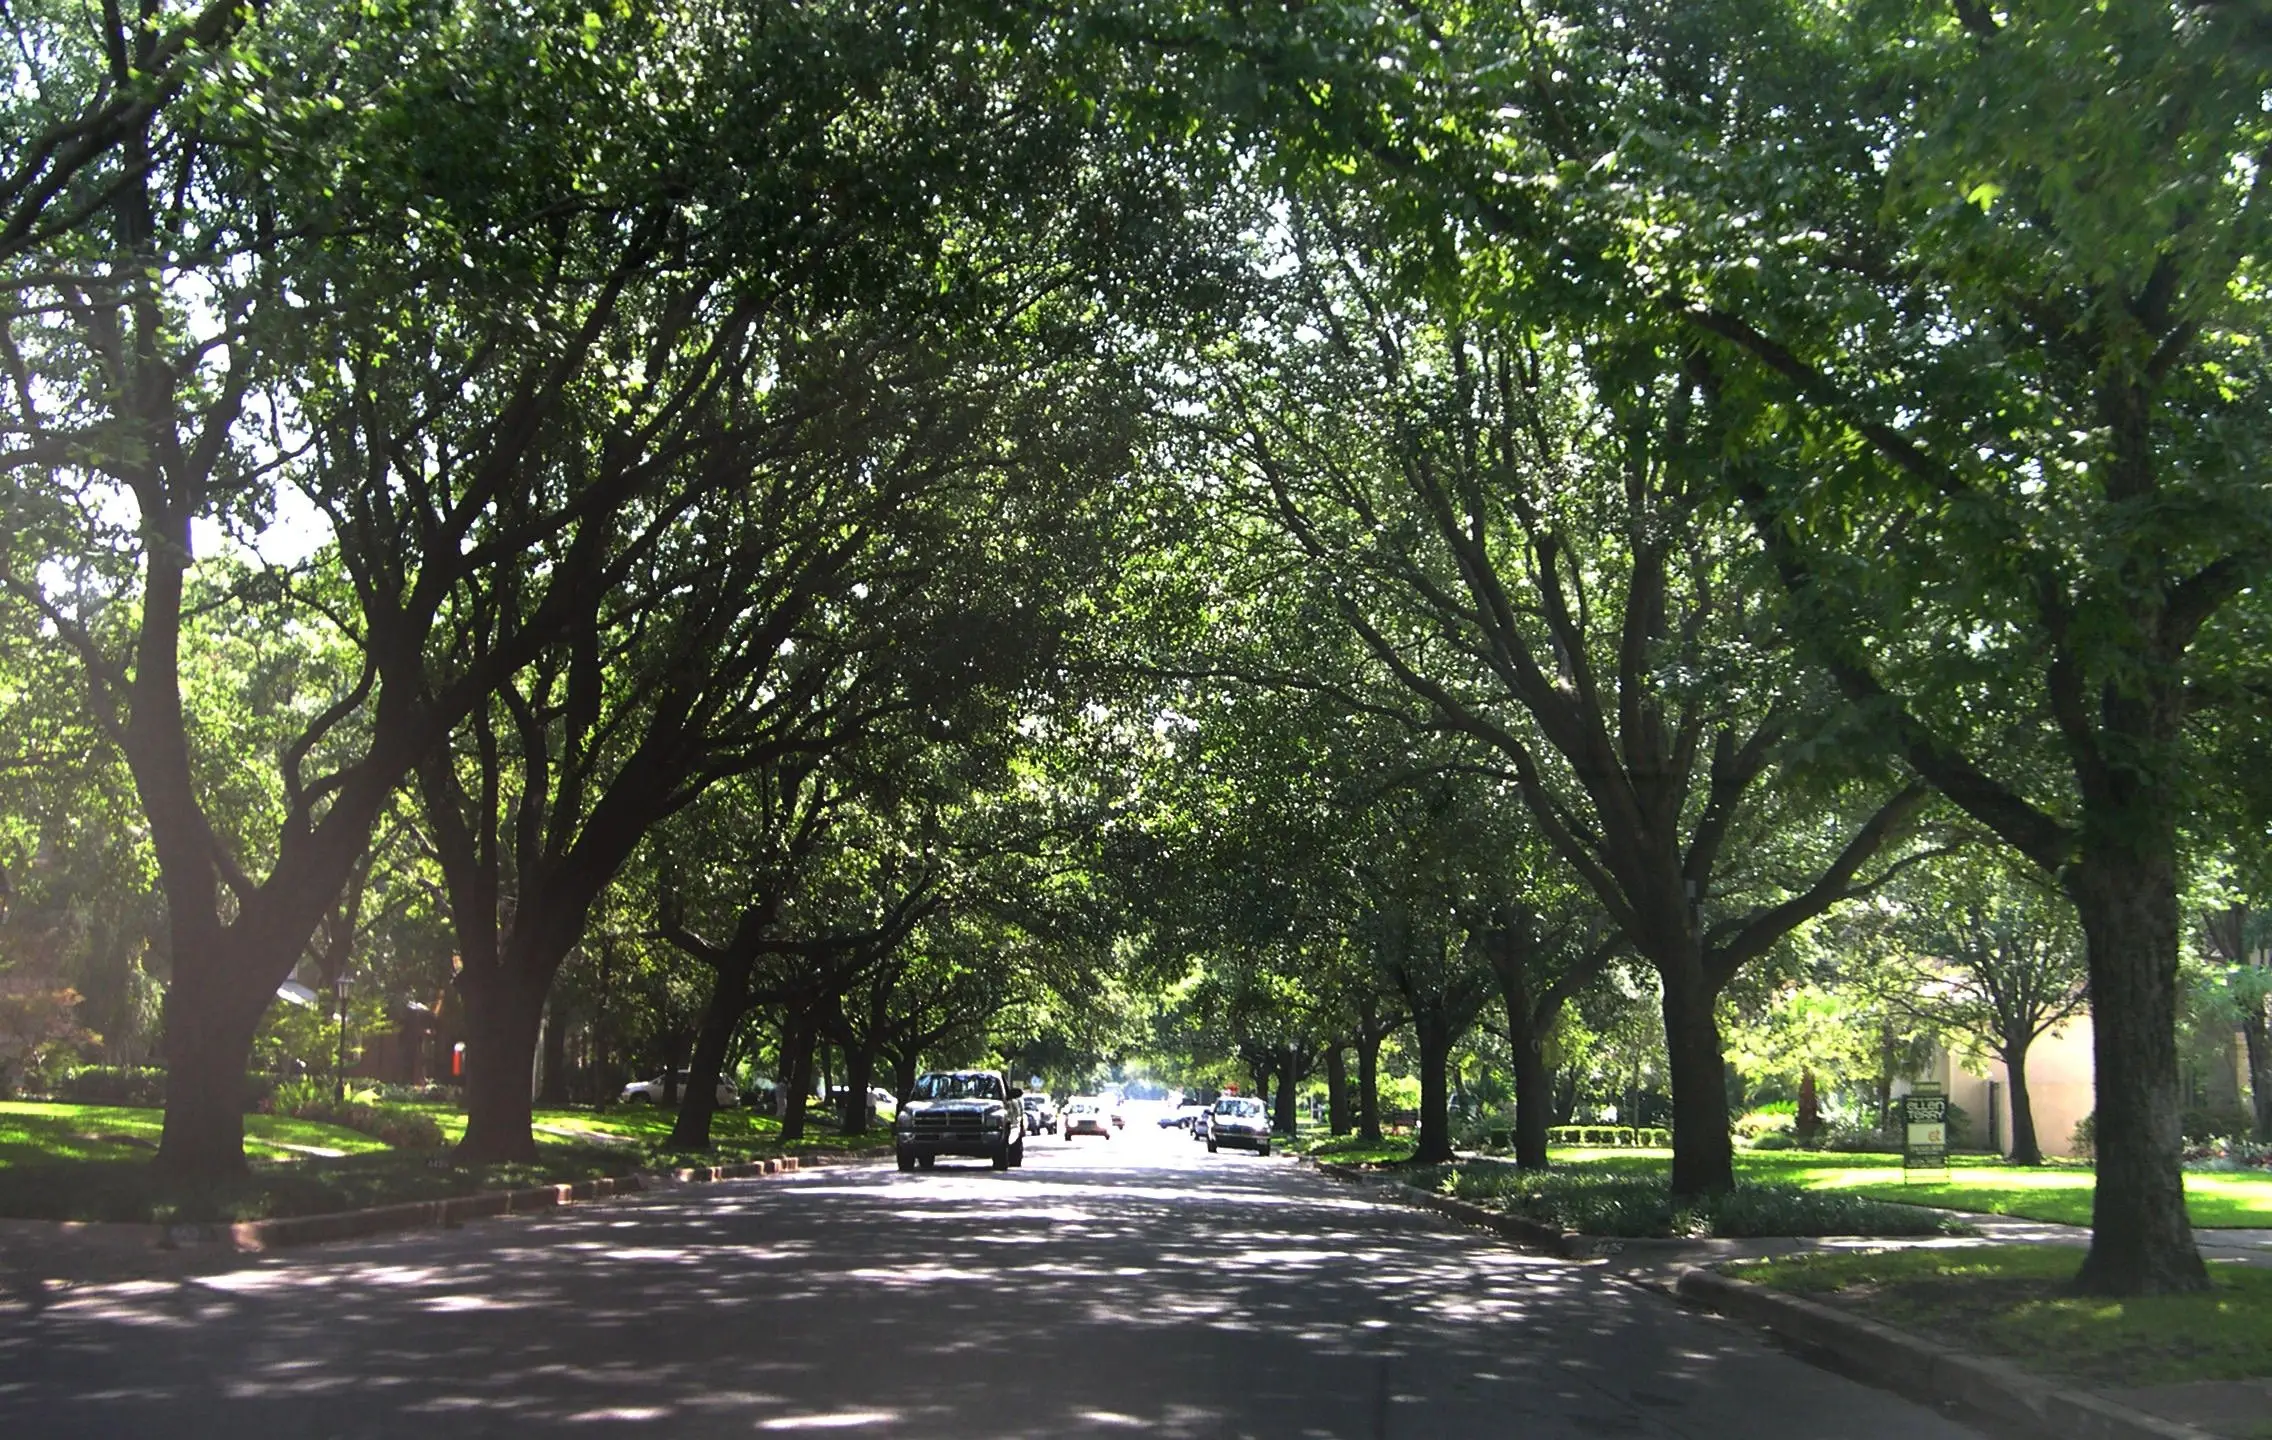
A residential street under the oak canopy. Photo: Ansem27, CC BY-SA 3.0, animated with Higgsfield
Three heat maps of the same town
Each map averages nearby sales with a distance-weighted kernel, so a cell reflects the sales around it, and cells with too little nearby evidence are left blank. The location premium map uses the part of each sale's price that the house itself does not explain: the residual from the hedonic model with street terms removed. A red cell means homes there sold for more than an identical home elsewhere in town. The price per square foot map shows nominal prices by period on one fixed color scale, so the town visibly heats from period to period. The land value map uses only teardown sales, priced per square foot of lot and adjusted to 2026.
The premium map has one clear center. The highest cells follow Turtle Creek, Exall Lake and Lakeside Park, and they fade within a few blocks. The far west, the Dallas ISD section and the blocks along Mockingbird Lane run below the town median. The land value map, drawn from far fewer sales, puts its highest values in the same place. The price per square foot periods show the scale shifting: in 2005 to 2009 most of the town sat in the green range, and by 2023 to 2026 nearly all of it was above $700.
None of these maps is an adjustment. A smoothed surface describes the market around a point; an appraiser still decides whether a subject competes with the sales that built the cell, and a reviewer still asks how many sales stand behind it. The probe reports a value for any point so that a reader can check a claim against the surface.
Location effects inside a 2.2 square mile town
One town, two school districts
The westernmost blocks of Highland Park have the same town government and services as the rest of the town and are zoned to Dallas ISD. Holding living area, lot size, age, pool and sale year constant, a home there sold for 21% to 24% less than an equivalent home in the Highland Park ISD part of town, in every period since 2005. The intervals overlap, so the data shows no trend in the gap.
Distance to the Turtle Creek corridor
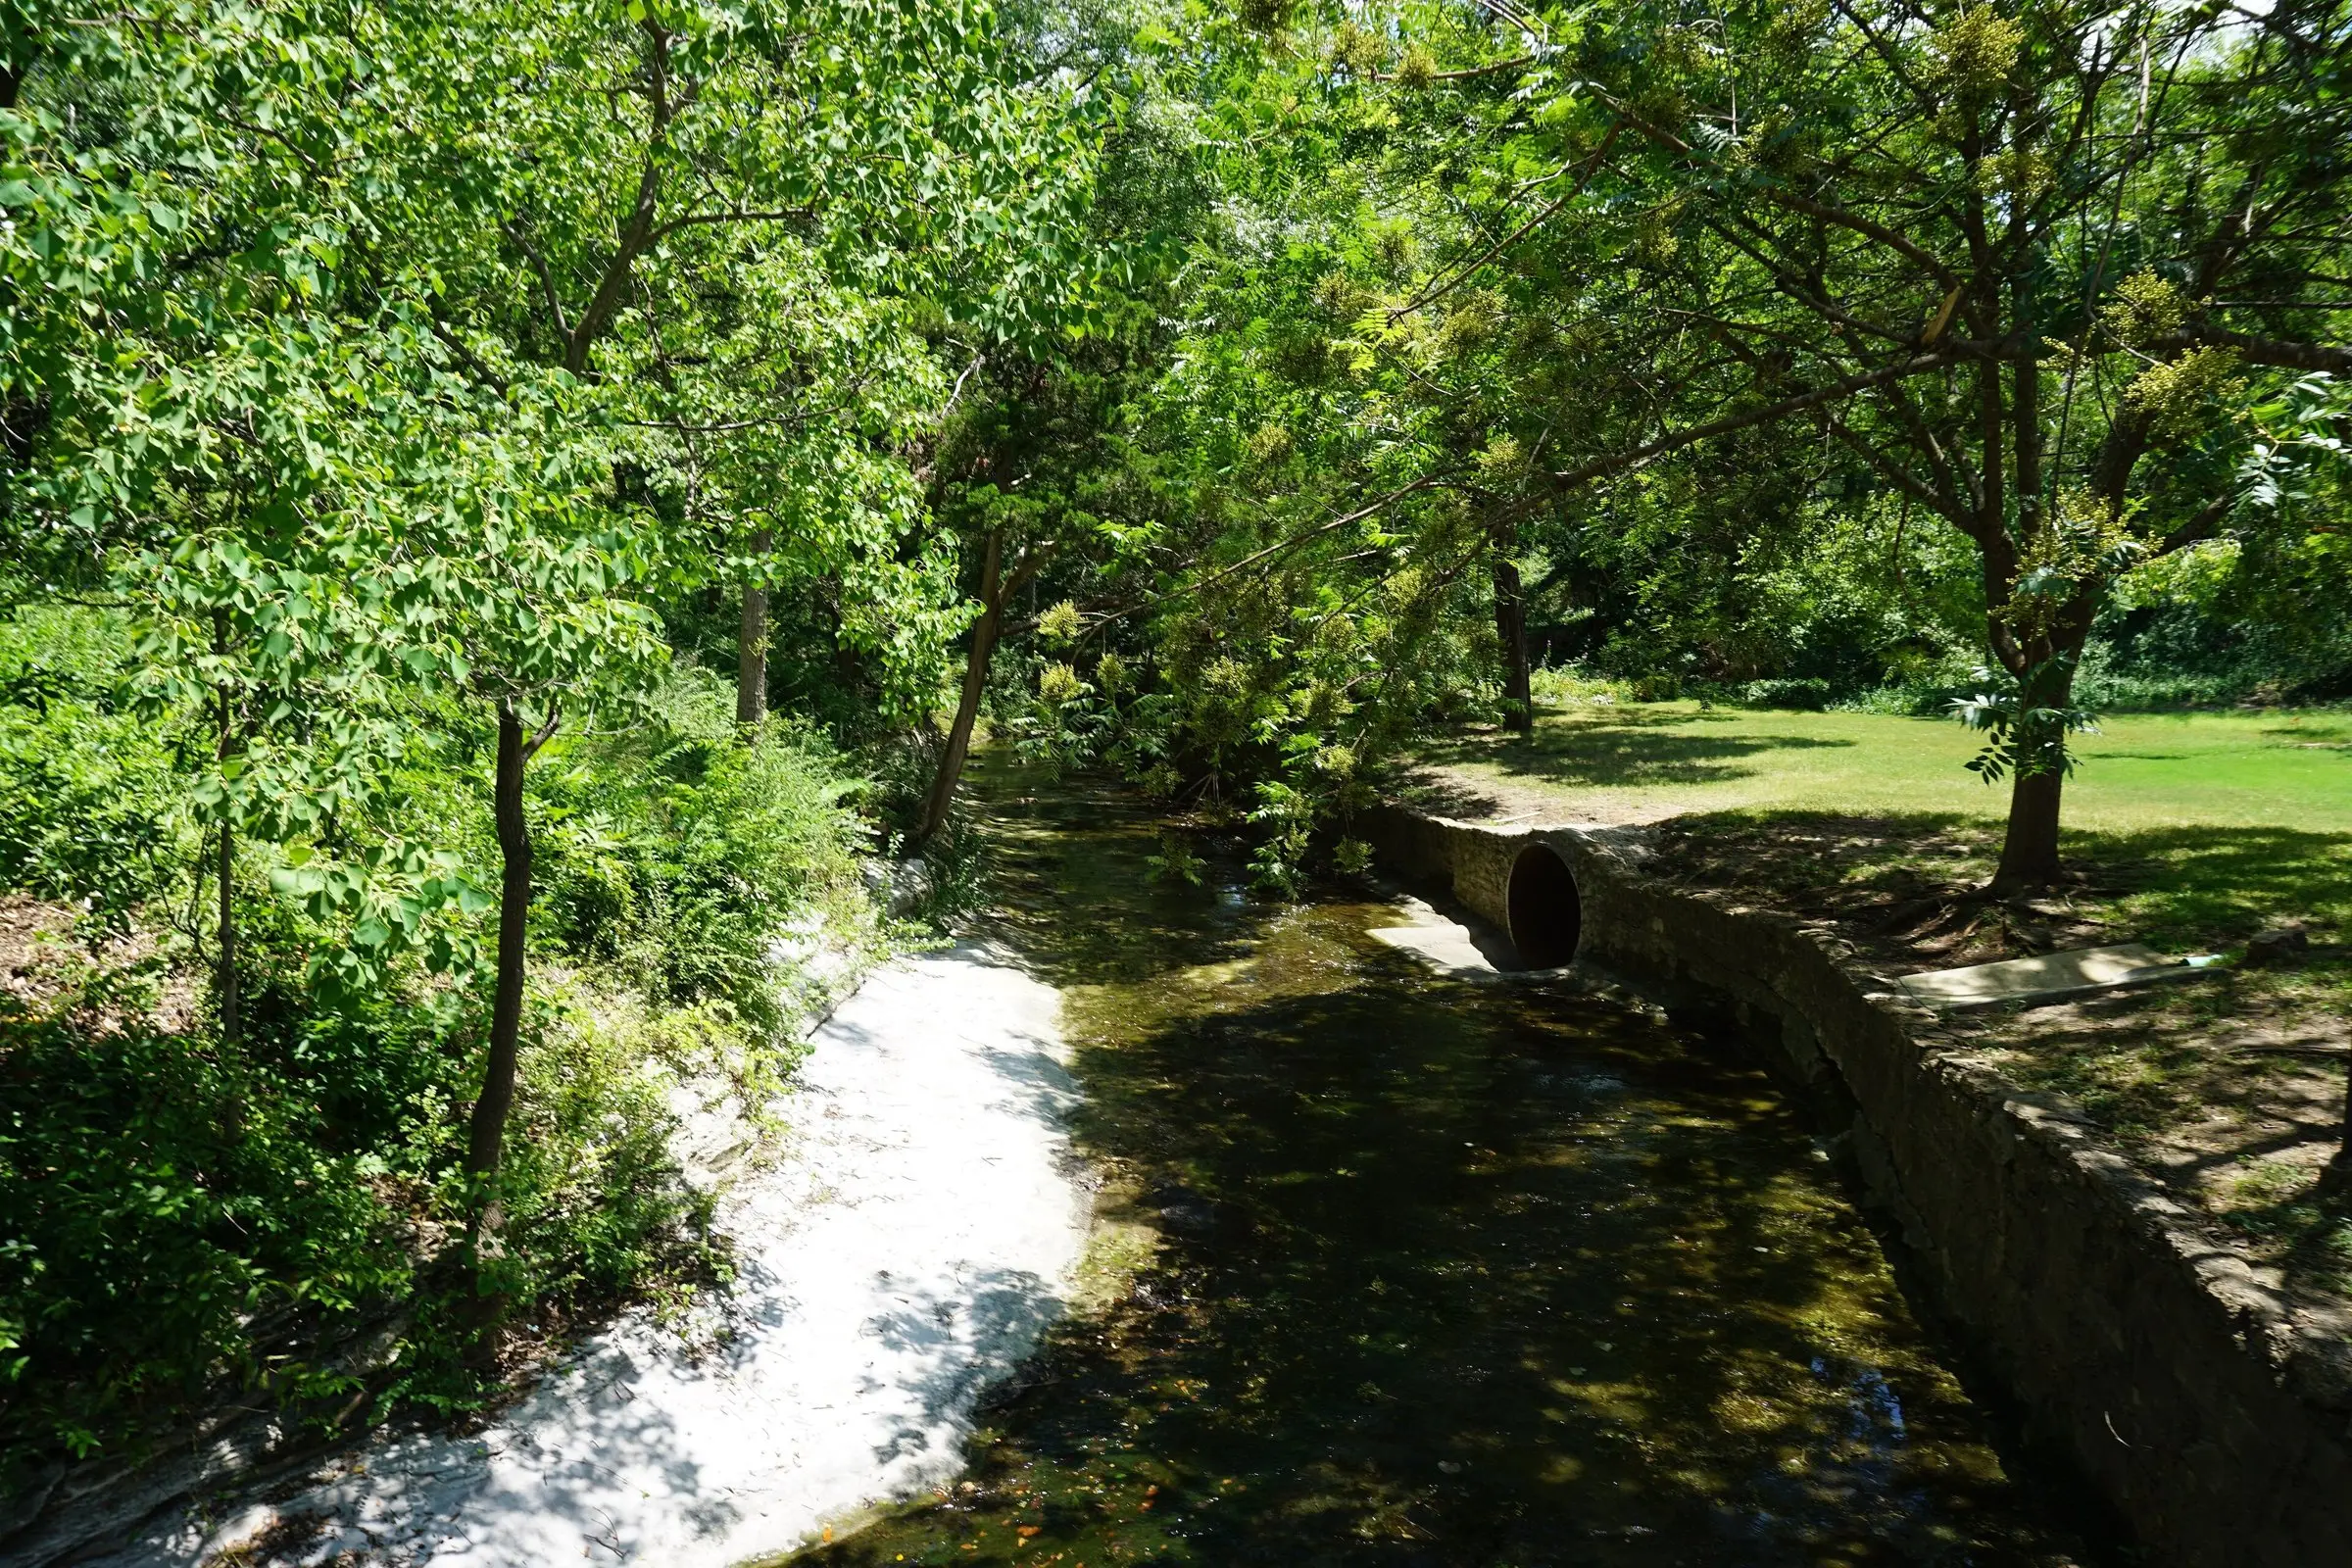
Turtle Creek runs through the middle of town, widening into Exall Lake and the lawns of Lakeside Park. Measured from the creek, the lake and the park, sales within 150 meters carried a location premium of 15% over the house-adjusted town average, and sales 150 to 300 meters away 10%. Beyond 300 meters the premium was close to zero. The median sale in town sits 671 meters from the corridor.
The shopping center at Preston Road and Mockingbird Lane shows a weaker gradient: a premium of 7% at 400 to 800 meters, falling to -4% beyond 1,600 meters. Much of that overlaps with the creek effect, since the corridor passes within a few blocks of the Village. Sales fronting Mockingbird Lane, Preston Road or Lomo Alto Drive, nearly all of them on Mockingbird, carried a 23% discount on 68 sales.
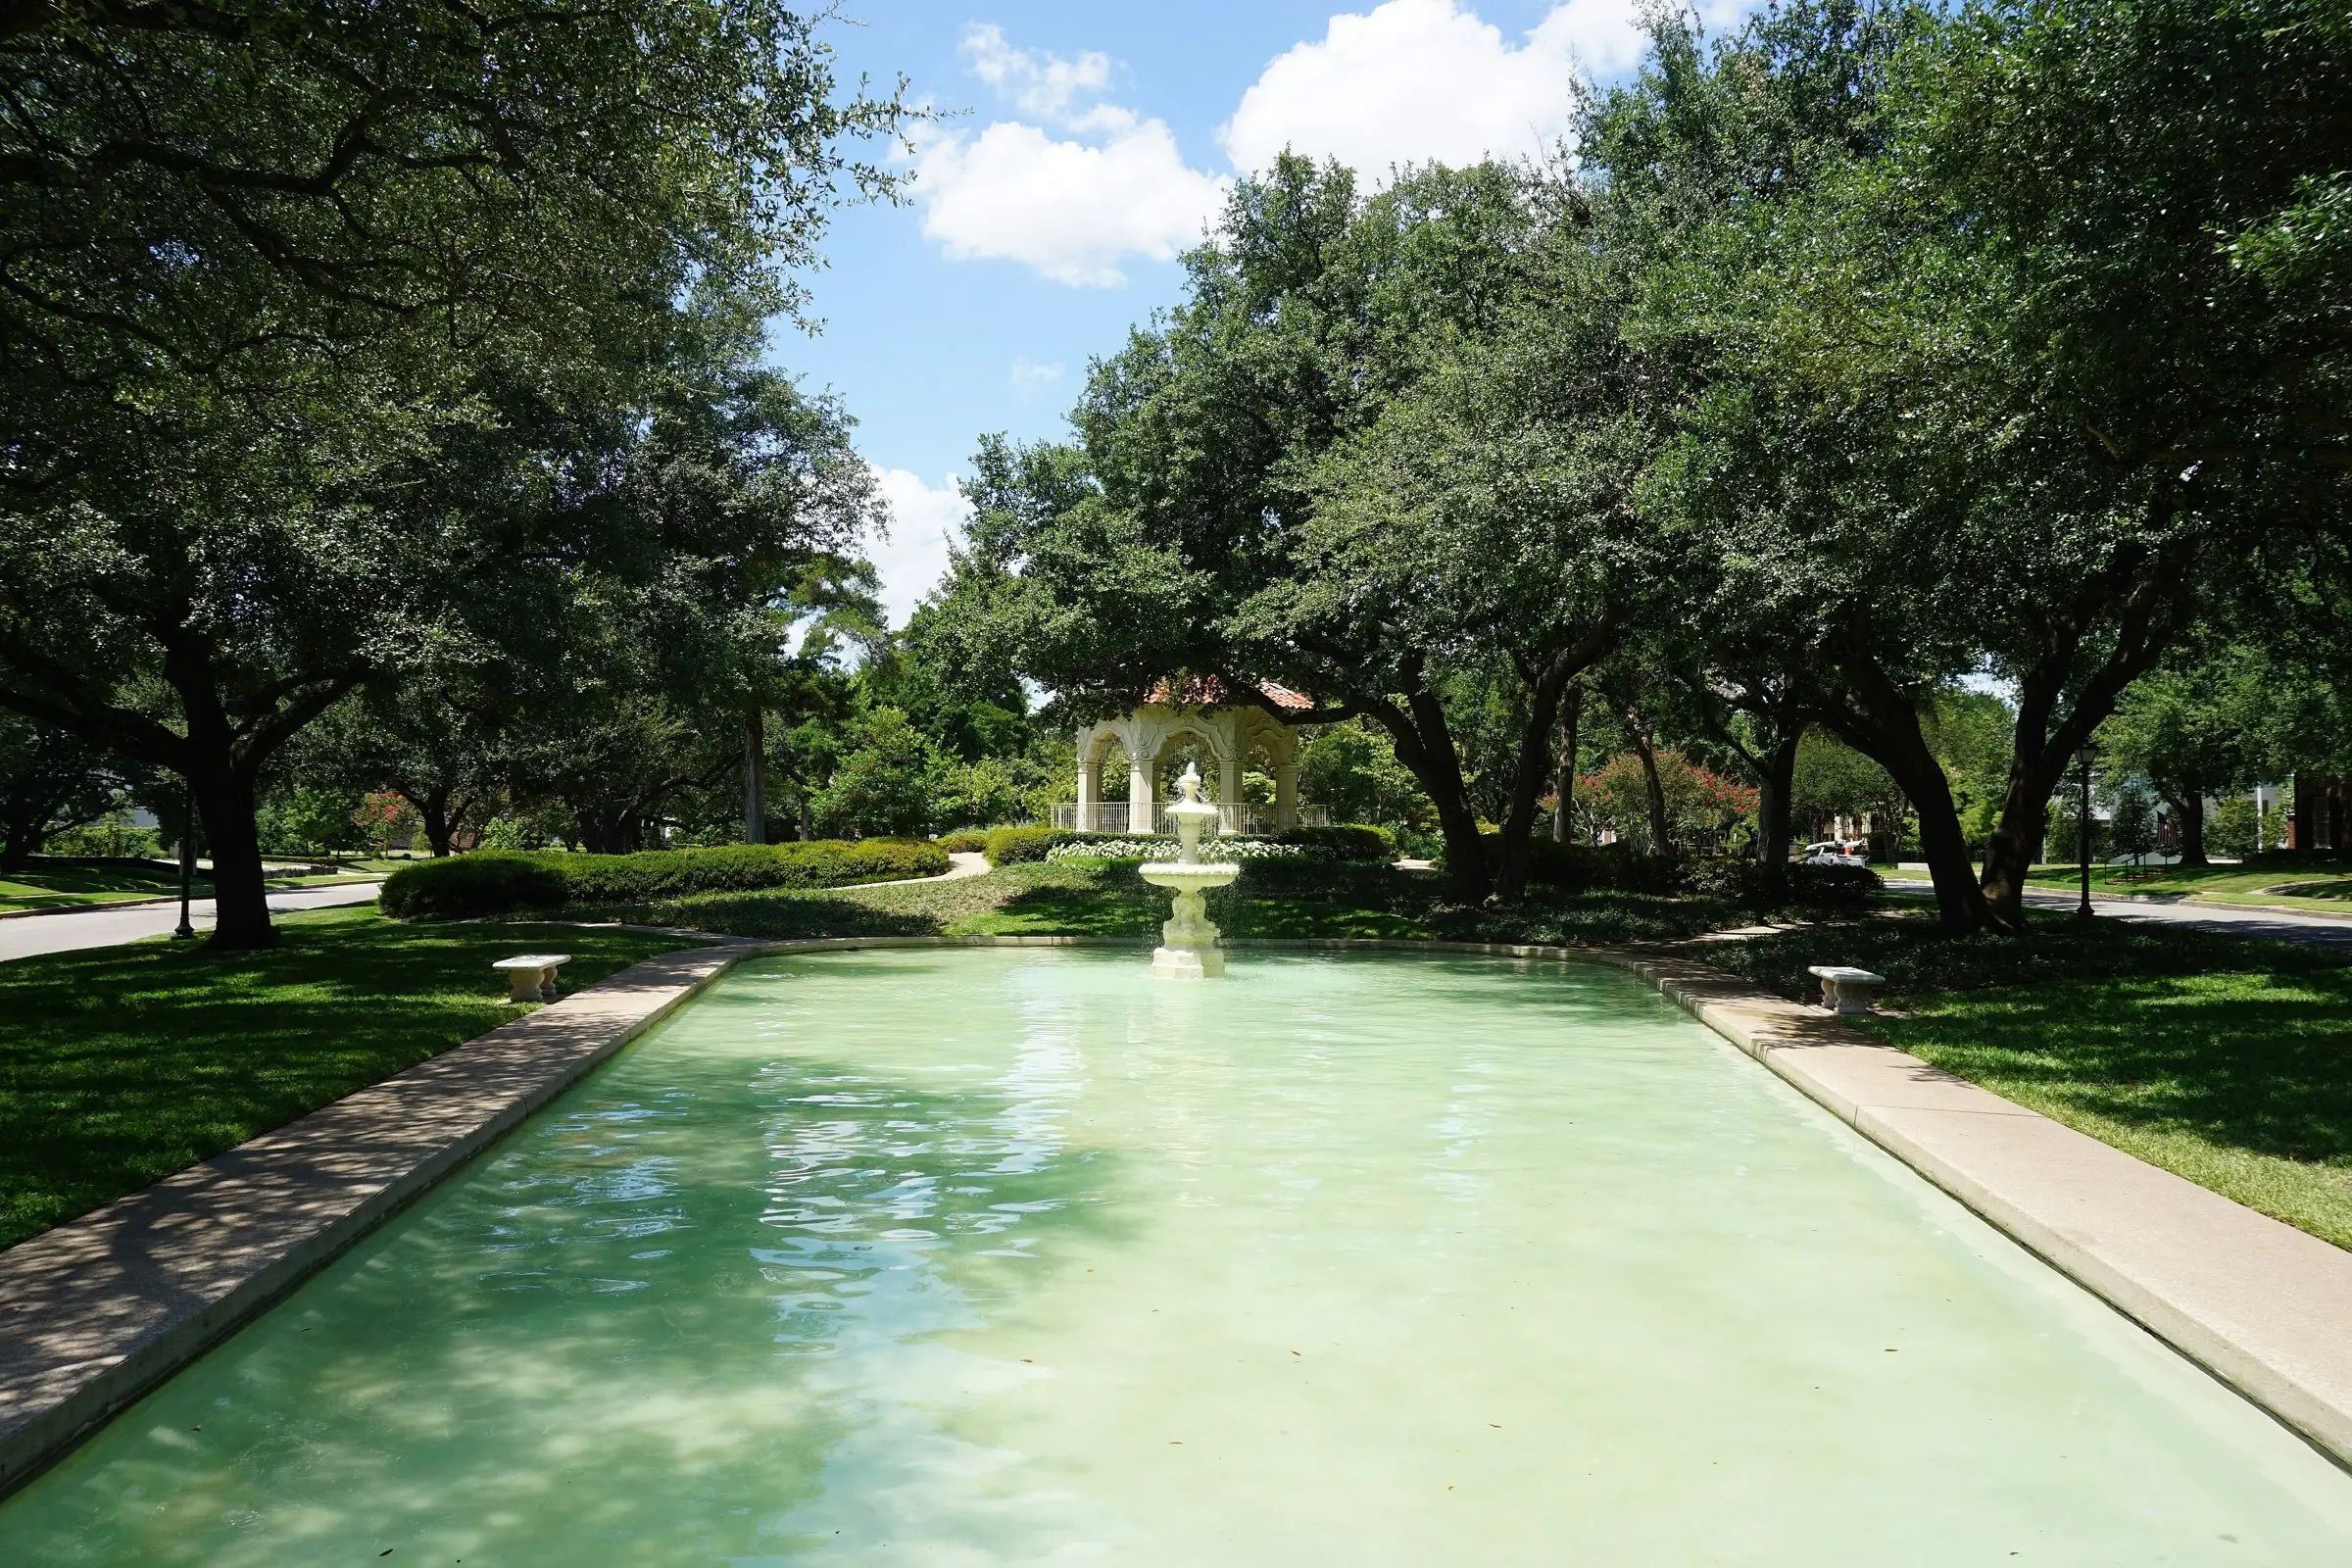
Flippen Park. Photo: Michael Barera, CC BY-SA 4.0, animated with Higgsfield
Miramar, Stratford and Lexington lead the street ranking
Ranking streets by median price rewards the streets with the largest lots and houses. To rank desirability, we gave every street with at least 15 sales its own term in the hedonic model and expressed each as a premium over the sales-weighted town average, holding living area, lot size, age, pool, stories and sale year constant. Sections of a street in the Dallas ISD part of town are ranked separately. We then refit the model 400 times on resampled data to see how stable the order is.
1
Miramar Avenue
+37.9%premium, 90% range +25.9% to +51.8%
- Sales
- 16
- Top three in resamples
- 96%
- Median price, 2026 dollars
- $8.2M
- Median lot
- 15,768 sq ft
- Distance to creek corridor
- 208 m
2
Stratford Avenue
+30.6%premium, 90% range +21.9% to +39.4%
- Sales
- 25
- Top three in resamples
- 85%
- Median price, 2026 dollars
- $7.7M
- Median lot
- 14,549 sq ft
- Distance to creek corridor
- 214 m
3
Lexington Avenue
+29.0%premium, 90% range +16.3% to +42.4%
- Sales
- 20
- Top three in resamples
- 66%
- Median price, 2026 dollars
- $12.1M
- Median lot
- 20,843 sq ft
- Distance to creek corridor
- 346 m
Miramar ranked in the top three in 96% of the resampled fits, Stratford in 85% and Lexington in 66%. Gillon, at +25.8% on 35 sales, made the top three in 46%, so the third place is the least settled. The six highest-ranked streets all sit a median of about 200 to 350 meters from the creek corridor, against 671 meters for the town as a whole.
Beverly Drive, the street with the most sales in the export, ranks 10th at +11.1% on 155 sales. Its high prices come mostly from its lots: a median of 12,022 square feet. Lakeside (8 sales, median $16.2M); Armstrong (14 sales, median $12.2M); Highland (9 sales, median $9.4M); and Crescent (12 sales, median $14.3M) have too few sales to rank, though their medians are the highest in town.
- Highland Park ISD
- Dallas ISD section
At the other end, Westway, Mockingbird and Fairway ran 23% to 26% below the town average, and every Dallas ISD street section sat between −15% and −31%. Beverly Drive appears twice: its Highland Park ISD section at +11% and its Dallas ISD section at −31%, a spread on a single street name that a street-level adjustment would miss.
Size, timing, lot and location explain most of the price
We trained a gradient-boosted tree model to predict log sale price from twelve inputs and tested it with five-fold cross-validation, so every prediction is scored on sales the model did not see. It explained 94% of the variation in log price, and its median prediction missed the actual price by 10.5%. To rank the inputs, we shuffled each column in turn and measured how much worse the predictions became. That measure is called permutation importance; inputs that move together share credit, so the bars rank influence and do not add to 100.
Map location combines east-west and north-south position. School district looks small here because the map position already carries it: the Dallas ISD section is the town's west end.
The hedonic model puts the same effects in units an appraiser uses. Holding everything else constant:
- +6.8%for 10% more living area
- +6.1%for 10% more lot
- +31.1%for new construction (two years old or less)
- +3.7%for a pool
- −26.6%for the Dallas ISD section, with street terms in the model
Lot size carries almost as much weight per percent as living area, a sign of how much of the price is land. The pool coefficient is small; 42% of the listings in the export have a pool. Bedroom and bathroom counts add almost nothing once living area is known. For a reviewer, these coefficients are a check on grid adjustments: a lot adjustment that implies a much smaller effect than the market's own evidence, or a pool adjustment far above 4%, deserves a question.
About 71% of a typical sale price is land
The export does not say which buyers demolished the house, but it can be inferred. When the same parcel sells again later with a year built at least five years newer, the earlier sale was almost certainly a teardown. Adding listings that describe the value as being in the land, for homes at least 40 years old, gives 183 teardown sales since 2005. Their price per square foot of lot is a direct reading of land value.
9,626 sq ft median lot × $286 per sq ft = $2.75 million, against a $3.9 million median sale price
Teardown buyers paid about $100 per lot square foot in 2005 and 2006 and $235 to $272 in 2022 to 2024. Adjusted to 2026 with the index, the median teardown in the Highland Park ISD section paid $286 per lot square foot. At that rate the median lot in recent sales is worth about $2.8 million, roughly 71% of the $3.9 million median price. The share of sold homes built since 2000 rose from 6% in 2005 to 37% in 2024.
For collateral risk, the improvements are the smaller part of the collateral, so condition and functional obsolescence move value less than they would in most markets, and a large part of the value sits in the location and lot, which do not depreciate. A cost approach in this market rests on the land estimate, and teardown sales are the most direct evidence for it. Few teardowns closed in 2025 and 2026, so the recent land estimate is thin.
Slower than 2022, with a wide gap between asking and closing prices
Median marketing time went from 104 days in 2009 to 6 in 2022 and 26 in 2026. Sellers received a median 100% of their original asking price in 2022 and 95.5% in 2026. On Oct. 14 the export showed 28 active listings with a median asking price of $6.39M, 64% above the $3.90M median of the 81 sales that closed in the prior 12 months. At that closing pace the active listings represent 4.1 months of supply.
The export carries cancelled and expired listings only from 2021 on, so earlier years cannot be compared. *2026 listings are still being decided.
Jun has the most closings (315); January the fewest (123). The sale-to-list ratio peaks in March at 97.7% and bottoms in January at 95.2%.
From 2022 through 2025, 44% of listings that ended did so without a sale. A list price in this market is weak evidence of value, and an appraisal that leans on active listings to support a conclusion should show how often listings at that price have failed to close.
Time adjustment with its uncertainty
A quarterly version of the hedonic index since 2019 shows how noisy short-period measures are in a market of about 20 to 30 sales a quarter. The band is the 95% confidence interval. Pick the quarter of a comparable sale to see the adjustment to the third quarter of 2026 and its range.
+0.0%to Q3 2026
The range combines the two quarters' intervals and treats them as independent, which overstates the width slightly. Annual index: +5.6% from 2025 to 2026.

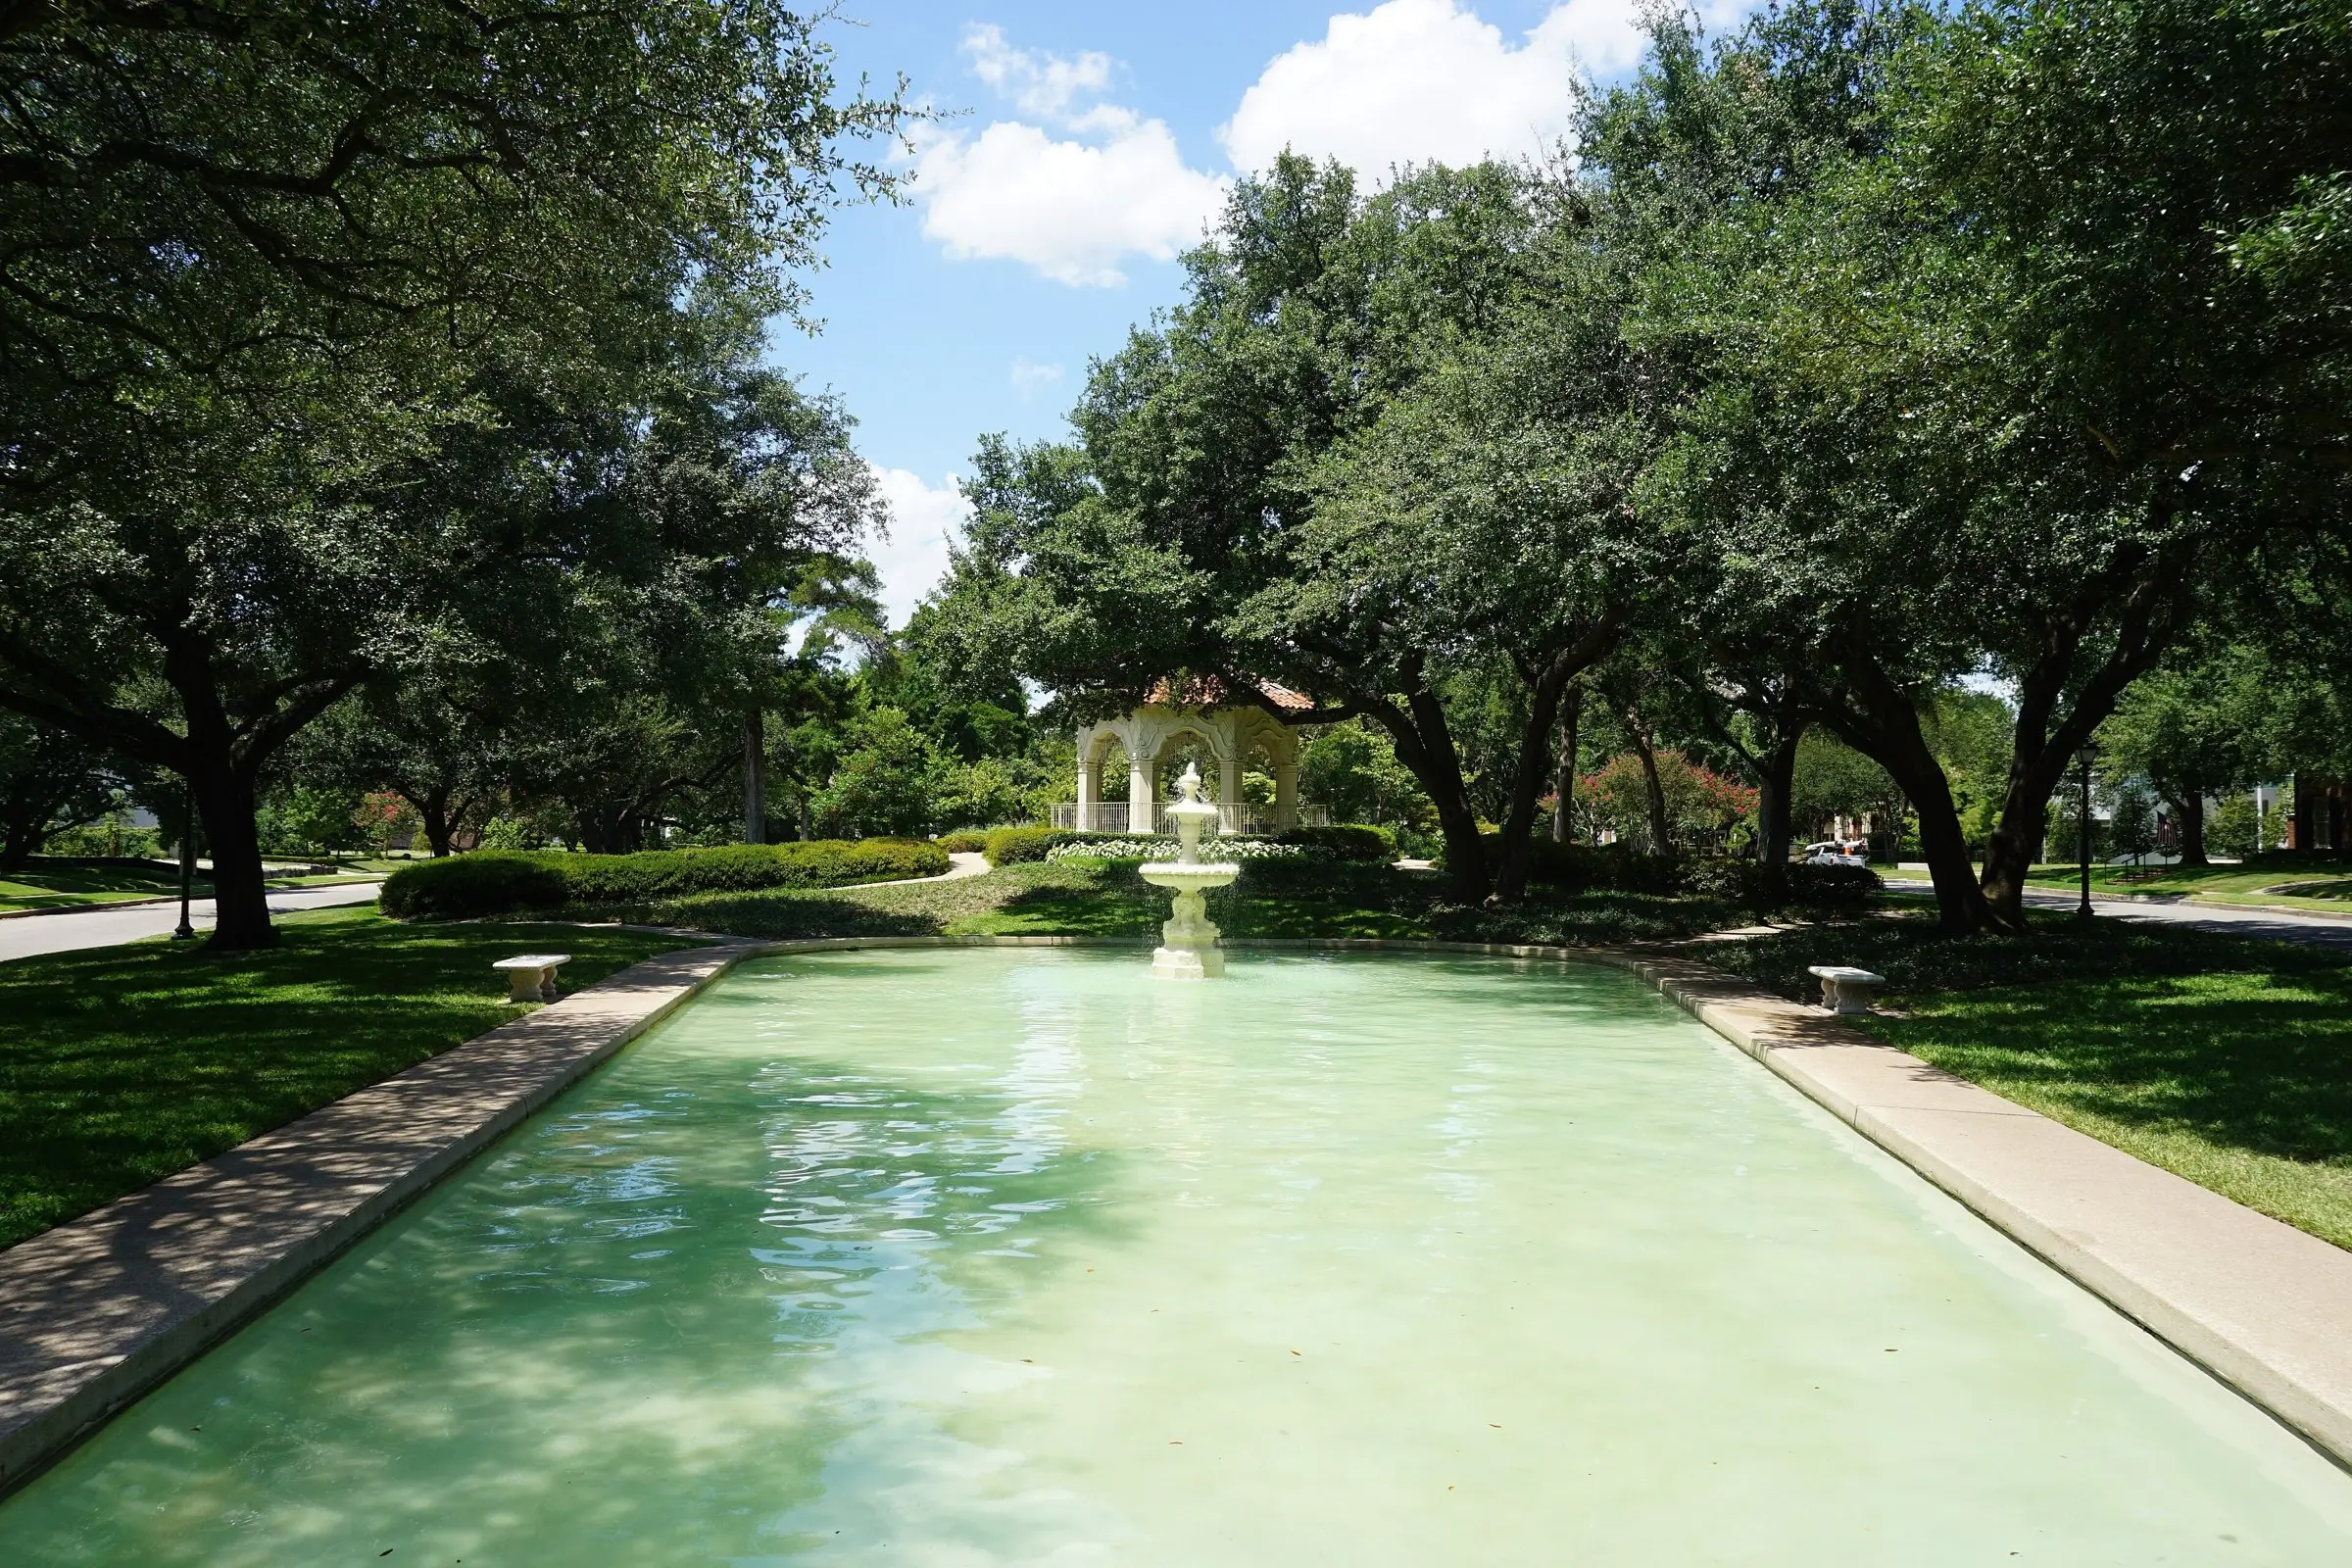
The fountain at Highland Park Town Hall. Photo: Michael Barera, CC BY-SA 4.0, animated with Higgsfield
What an appraisal's market analysis could show
A market conditions section today usually reports counts, medians and days on market across a few lookback windows, then a checkbox. The analysis in this article took one export, a free geocoder and open map data. The same work could produce a short set of exhibits for each assignment, each one answering a question a reviewer or credit officer would otherwise have to ask.
The usual summary
| Prior 7 to 12 months | Prior 4 to 6 months | Current 3 months | |
|---|---|---|---|
| Sales | 30 | 24 | 26 |
| Median price | $3.08M | $4.13M | $4.18M |
| Days on market | 24 | 25 | 41 |
Property values
Highland Park windows ending Oct. 14, 2026, from this export. The median price rose 34% between the two older windows; the quality-adjusted index rose +5.6% from 2025 to 2026. The checkbox shown is a placeholder.
- 01Location surface with the subject marked
Shows whether the comparables come from the same part of the value surface as the subject, and how many sales support it.
See it above - 02Time index with a confidence band
Replaces a median-to-median adjustment with a quality-adjusted rate and the range around it.
See it above - 03Segment or street premium with an interval
States the location adjustment as a market-derived figure with its sample size.
See it above - 04Model check of the grid adjustments
Sets the report’s size, lot and amenity adjustments beside the market’s own coefficients.
See it above - 05Land evidence
In a land-heavy market, the teardown sales that support the site value.
See it above - 06Listing outcomes
How often listings at the subject’s price point closed, failed or sat.
See it above
Each exhibit has limits that belong next to it. A smoothed surface hides sharp edges such as a busy street or a district line. A street premium from 16 sales has a wide interval. A model's coefficients describe the market on average and can miss a feature that matters for one house. The export carries no concession data worth using (the seller-paid field is zero on nearly every sale), no condition ratings and no interior quality, so the models treat a renovated 1930s house and an original one alike.
For collateral risk teams, the same exhibits work as a review tool. A reviewer can place a subject on the surface, compare the report's time adjustment to the index band, and check that the location adjustment falls within the range the market supports. For Highland Park in late 2026, the figures to watch are the share of listings that fail to close, the gap between asking and closing prices, and whether teardown buyers return at prices near the 2022 to 2024 level.
Data: aggregates from an MLS export of single-family listings in the Town of Highland Park, Texas, closed sales from 2004-12-01 through 2026-10-14: 3,248 listing records, 2,882 closed sales, 2,758 geocoded inside the town limit and 2,470 used in the models. No addresses, listing numbers or individual sales are published; maps show smoothed surfaces and cell counts. Geocoding: U.S. Census Bureau Geocoder. Streets, parks, water and the town limit: OpenStreetMap contributors (ODbL). Photographs from Wikimedia Commons as credited; animated clips are Higgsfield adaptations of those photographs and carry the same licenses. Research checked Oct. 24, 2026. General information, not lending, legal or investment advice.
Methods and known limits
- Hedonic index: ordinary least squares on log price with log living area, log lot size, new construction (two years or less), age 3 to 25 years, pool, three or more stories, Dallas ISD, street terms for streets with 15 or more sales, and year terms. The year terms, exponentiated and rebased to 2005, are the index. 2004 holds five sales and is not shown.
- Repeat sales: pairs of consecutive sales of one parcel with the same year built, living area within 10% and at least six months apart, fit by least squares on year terms.
- Location premium surface: the residual of the hedonic model without street terms, smoothed with a Gaussian kernel (140 meter bandwidth) on a 50 meter grid, shown relative to the town's median cell. Cells with a kernel weight below five sales are blank.
- Price per square foot by period: nominal price per living square foot, smoothed in logs with a 170 meter bandwidth.
- Land value: teardown sales identified by a later sale of the same parcel with a year built five or more years newer, or by listing text describing land value for homes 40 or more years old. Price per lot square foot, adjusted to 2026 with the annual index, smoothed with a 260 meter bandwidth.
- Street ranking: street and district segments with 15 or more sales, as terms in the hedonic model, centered on the sales-weighted average. Ranges are the 5th and 95th percentiles of 400 bootstrap refits.
- Value drivers: scikit-learn histogram gradient boosting, five-fold cross-validated; permutation importance with eight repeats on the fitted model.
- Distances are straight-line meters from each geocoded sale to the nearest mapped point of Turtle Creek, Exall Lake, Hackberry Creek or Lakeside Park, and to the center of Highland Park Village.
- Geocodes are street-segment interpolations, not surveyed parcel points, and can be off by a few lots. 94 closed sales did not geocode.
- Failed listings appear in the export only from 2021, which limits the failure rate to recent years.
Sources and credits
- U.S. Census Bureau Geocoder, batch address matching, accessed Oct. 24, 2026
- OpenStreetMap contributors, streets, parks, water and municipal boundaries, ODbL
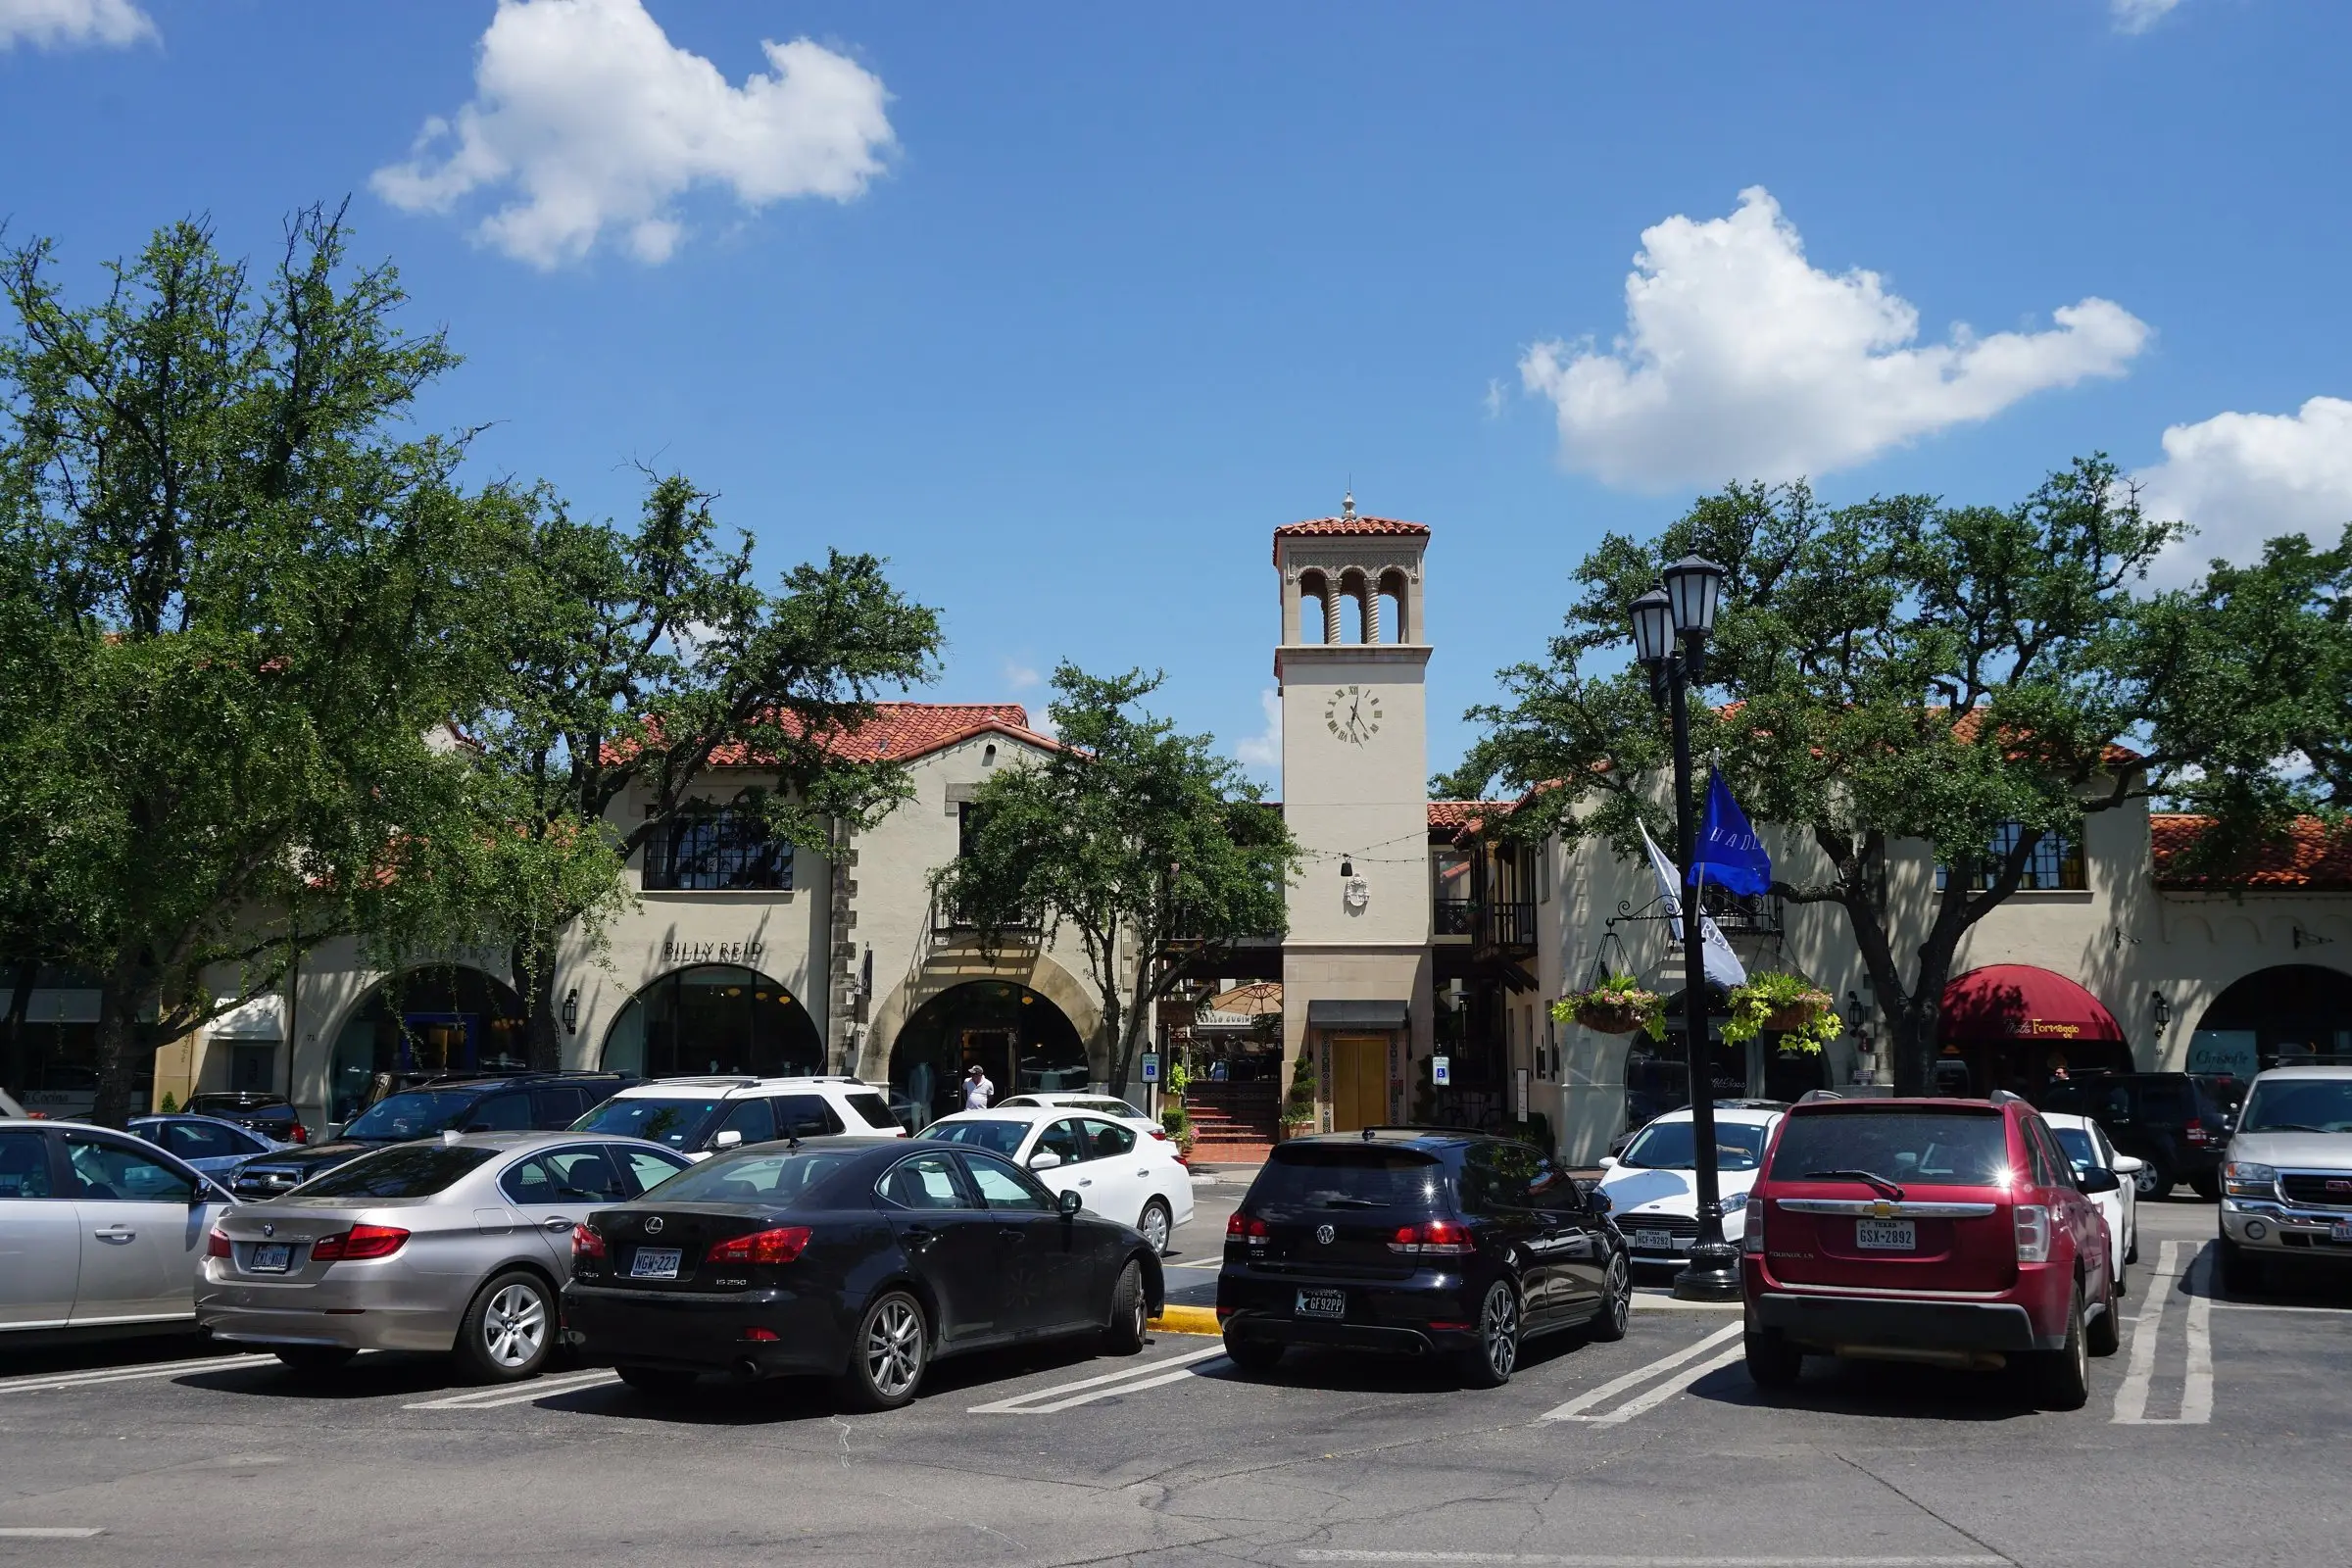
- Wikimedia Commons, Highland Park, Texas: photographs by Michael Barera (CC BY-SA 4.0) and Ansem27 (CC BY-SA 3.0)
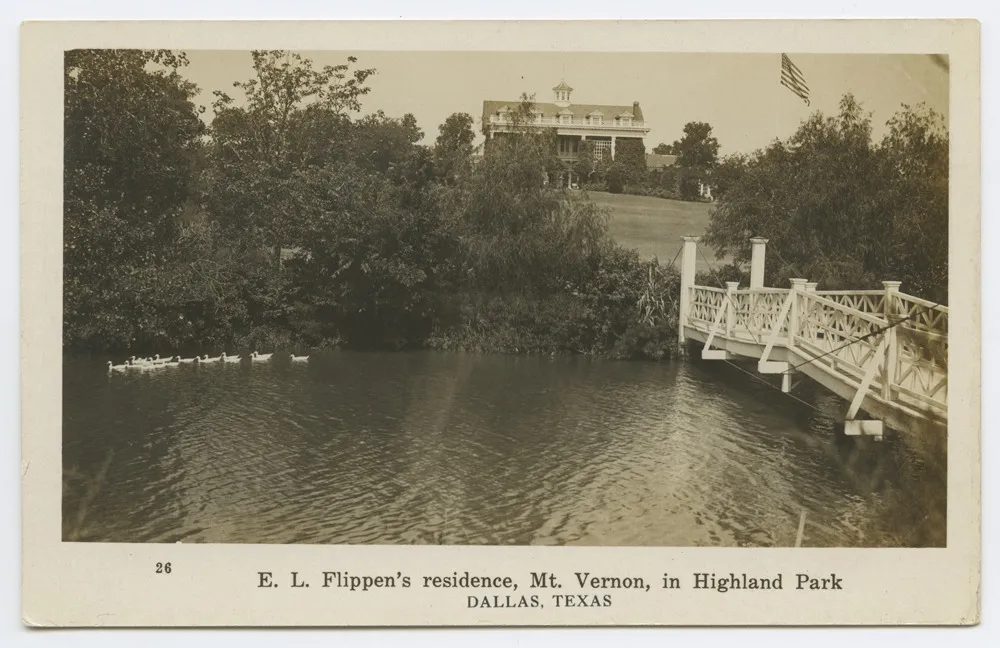
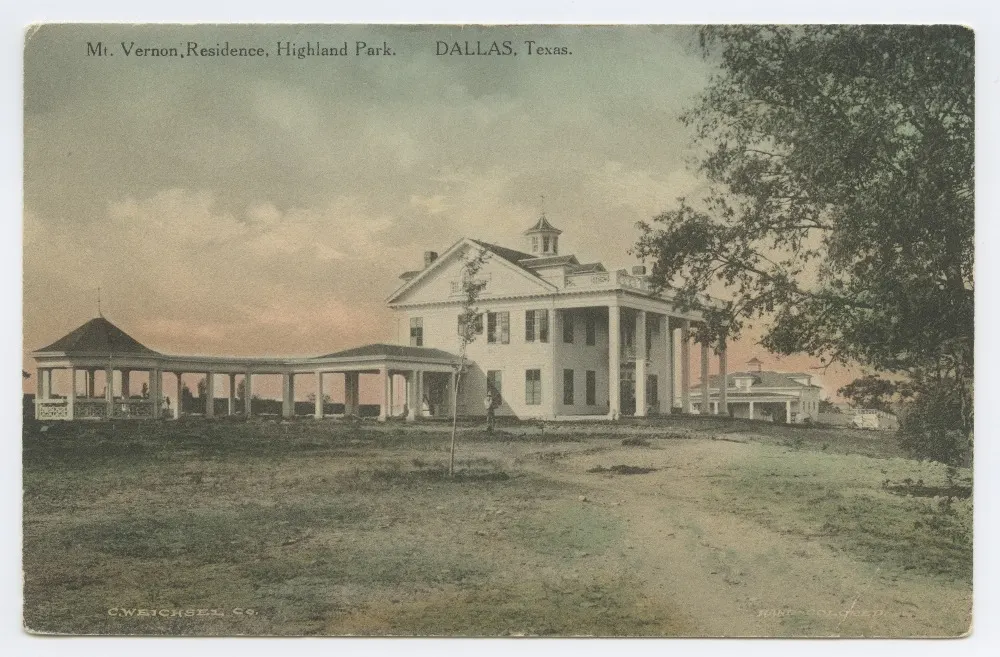
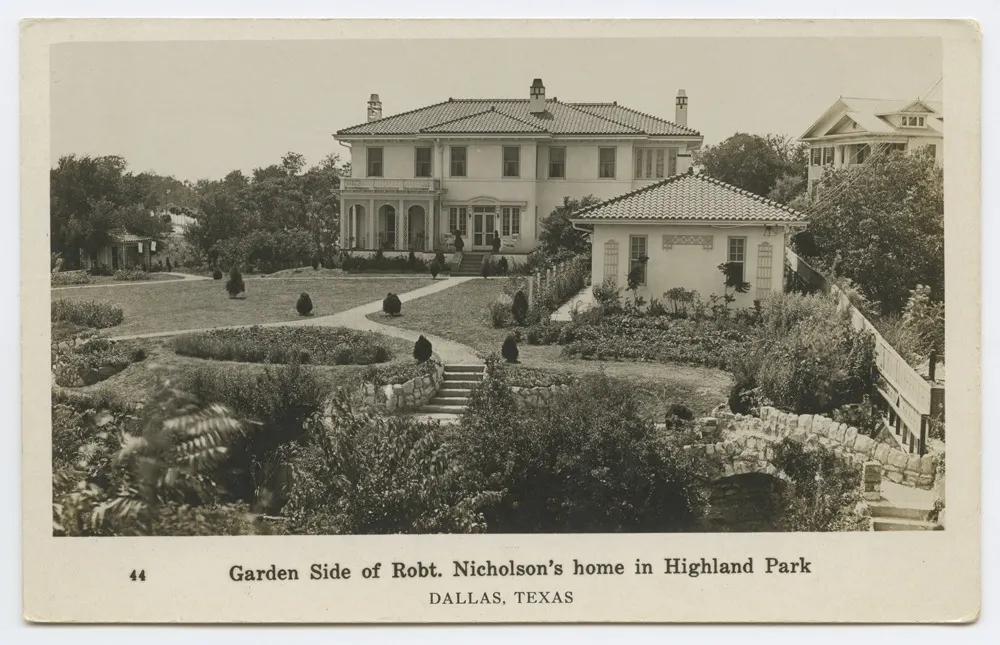
- SMU Central University Libraries postcards via Wikimedia Commons, no known restrictions
The Signal / Twice-monthly briefing
Follow valuation policy, collateral risk and property technology, with sources.
Unsubscribe in one click. We don't sell your email or share it with sponsors. Privacy Policy