
The Signal / Market analysis / October 24, 2026
Dallas County's two housing marketsSix years of single-family sales and leases, zip by zip, and what the data shows this fall
110,956 closed sales and 38,838 closed leases from MLS records, October 2020 to October 2026. The expensive half of the county kept appreciating after 2022. The entry-level half gave back part of its gains, and that is where concessions, FHA loans and bank-owned listings have piled up.
- Closed sales
- 110,956
- Zips mapped
- 71
- Sales with concessions
- 31% 52%
From late 2020 to mid-2022, the price of the same house in Dallas County rose 36%. Since then the county index has moved inside a narrow band, 135 on a base of 100 today. The county figure averages two markets that have moved in opposite directions since 2022.
Homes in the top third of sale prices are worth 48% more than in late 2020 and set a new high in Q2 2026. Homes in the bottom third peaked in Q2 2022 and are 9% below that peak. Across 71 zip codes with enough sales to measure, a zip's price level and its six-year gain line up closely (rank correlation 0.73). The zips that gained least are the ones where buyers rely most on FHA loans and seller concessions, and where most of the county's bank-owned listings now sit.
This feature works through the MLS records for that split: prices, sale terms, supply, new construction, rents and credit. It closes with the readings to watch this fall and what they mean for appraisals and loan files. It extends our Highland Park heat maps and the Plano leading indicators feature to the whole county.
The same house, three price tiers, three different outcomes
A median sale price moves when the mix of homes changes. A repeat-sales index avoids that by following the same house from one sale to the next. We matched 3,970 pairs of sales of the same property, leaving out new construction, renovated homes, flips and bank sales, and split them into thirds by the first sale's price within its quarter.
Scroll to run the quarters
- High tier
- 145.7
- Mid tier
- 127.1
- Low tier
- 119.8
- County
- 132.3
Quarterly values move by several points on a few hundred pairs; the text quotes two-quarter averages.
All three tiers rose together until mid-2022: the county index reached 136 in Q2 2022, with the low tier at 136 and the high tier at 137. When mortgage rates moved from about 3% to above 6% that year, the tiers separated. The high tier dipped for two quarters and resumed rising; averaged over the last two quarters it stands at 148. The mid tier has held between about 124 and 134. The low tier has drifted down since its peak and averages 123 over the last two quarters, 9% below Q2 2022.
The county line, 135 now against a peak of 138 in Q2 2024, reads as a flat market. For a house in the bottom third of prices it has been a falling market for about three years, and for a house in the top third a rising one.
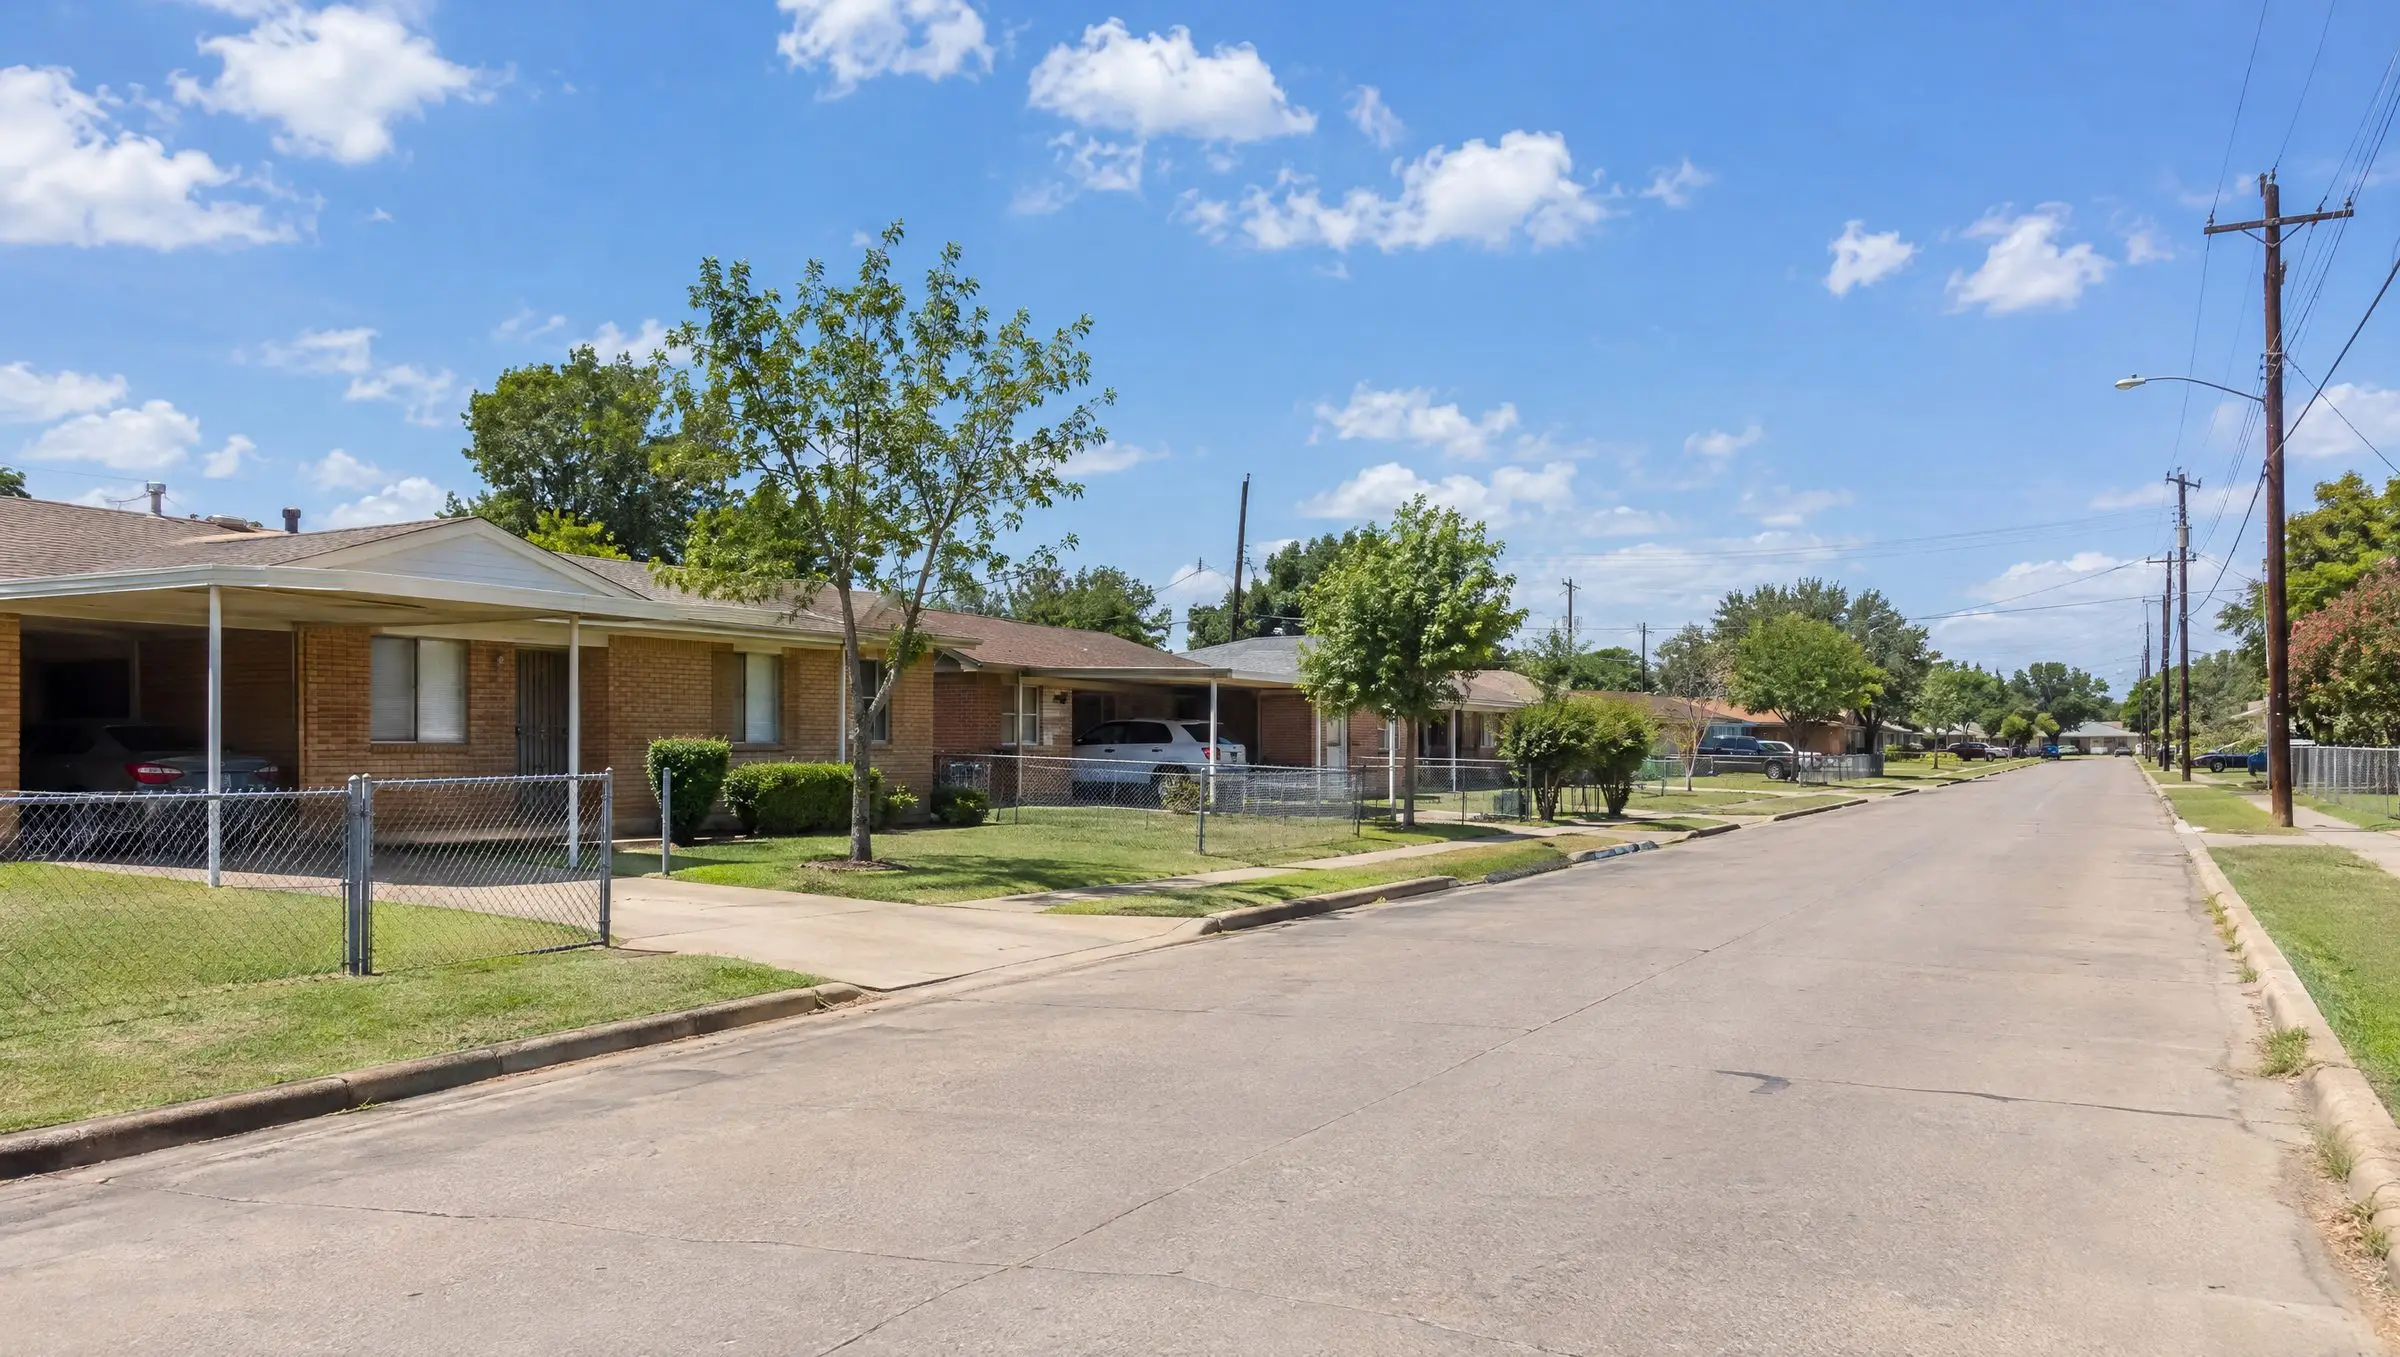
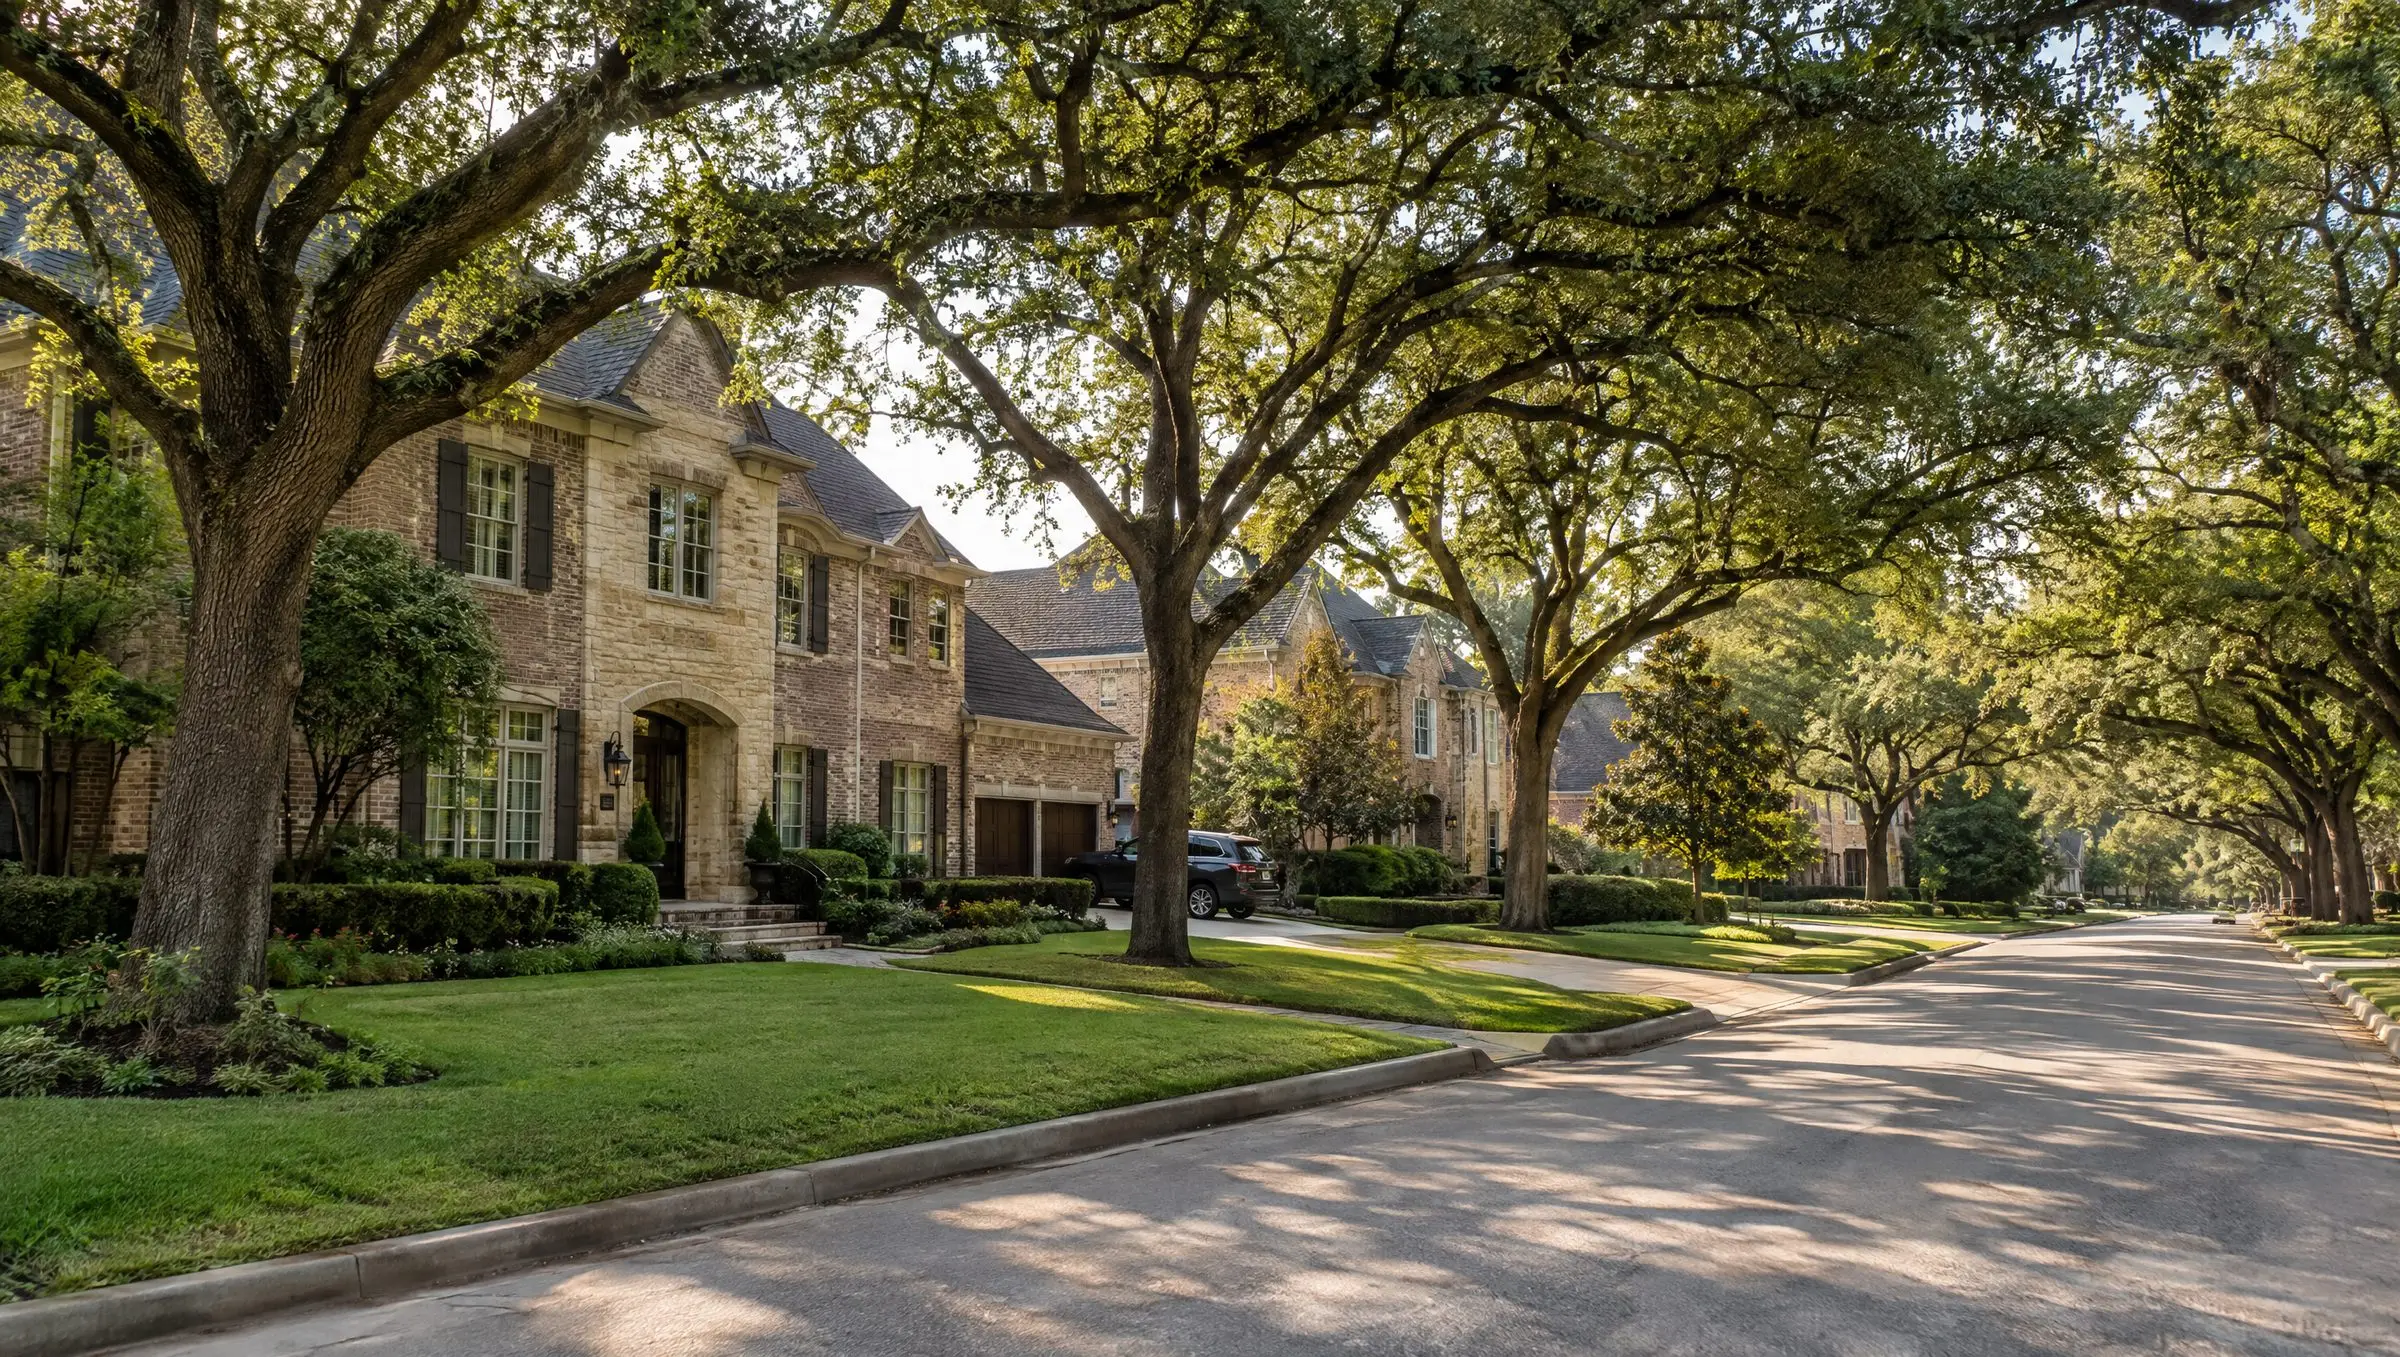
Top quarter of zips by price
- Median resale
- $865K
- Price per sq ft since 2020 to 2021
- +38%
- Sales with concessions
- 32%
- FHA share
- 1%
- Bank-owned listings since 2025
- 51
Bottom quarter of zips by price
- Median resale
- $253K
- Price per sq ft since 2020 to 2021
- +17%
- Sales with concessions
- 56%
- FHA share
- 34%
- Bank-owned listings since 2025
- 237
Medians across the 17 highest-priced and 17 lowest-priced zips, Oct. 2025 to Sep. 2026. AI-generated street illustrations (Higgsfield), not photographs of specific homes.
Where the county split, zip by zip
The map uses Census Bureau zip code tabulation areas clipped to the county line. Each zip's price change compares its median resale price per square foot in the twelve months to September 2026 with the twelve months to September 2021. County-wide, that figure rose 17.4%, from $167 to $196. The color scale is centered on inflation: the consumer price index rose 22.8% between September 2021 and September 2026,3 so zips in orange gained less than consumer prices and zips in blue gained more. Switch the layer to see sale terms, financing, rents and bank-owned listings on the same map, or step through the years.
The divide runs north to south more than along city lines. Most zips south of Interstate 30, and most of Garland, Mesquite and Rowlett to the east, gained less than inflation. The zips that beat it sit north of downtown, in the Park Cities and in Coppell, Carrollton and north Irving. The largest gains were in University Park (75205, +62%), 75244 (+50%), 75230 (+48%) and 75209 (+46%) in North Dallas and the Park Cities. The smallest were in 75211 (+3%), 75224 (+7%) and 75233 (+7%) in southwest Dallas and in Mesquite (+10%). By this measure the county as a whole, at 17.4%, trailed inflation, and the bottom zips trailed it most.
FHA loans financed 34% of sales in the median bottom-quarter zip and 1% in the median top-quarter zip; across all mapped zips the rank correlation between price level and FHA share is -0.90. Concessions follow the same line. Failed listings do not: about 41% of ended listings failed in both halves, so a slow sale is a county-wide condition while price weakness is concentrated.
Rank correlation between price level and change: 0.73. Hover a dot to find the zip on the map above.
Prices held up while sale terms gave way
The county median sale price has stayed between $345K and $385K since late 2022. The terms behind those prices moved much further. In Q2 2022, the median sale closed at 103.9% of its original list price, 69% closed above the last list price, and the median home sold in 7 days. In Q3 2026 those figures were 96.5%, 18% and 31 days.
Seller-paid concessions carried most of the adjustment. They appeared on 31% of sales in Q4 2020 and 52% in Q3 2026, and the median amount when paid rose from $3,000 to $8,000. As a share of price, the median concession went from 0.8% in 2021 to 2.1% in 2026, with a quarter of paid concessions above 3.0%. Net of concessions, the median resale price per square foot fell from $202 in 2024 to $194 in 2026; the gross figure fell from $204 to $198.
Concessions follow the financing. 80% of FHA-financed resales and 72% of VA resales included them, against 56% of conventional and 12% of cash purchases. FHA buyers bring the smallest down payments and need help with closing costs, so the price they pay often includes money that comes back to them at closing. For an appraisal, a contract price in a low-tier zip in 2026 more often includes a concession than not.
Inventory rebuilt and four in ten listings now fail
Expired and cancelled listings only appear in these records from late 2021, so the supply series start in January 2022. Active listings are rebuilt month by month from listing, contract and closing dates. Months of supply divides those listings by the average monthly closings over the prior year.
Failed listings include homes later relisted and sold, so the level overstates true failures; the trend is comparable across years.
Months of supply was under one in early 2022 and has held between about 3.5 and 4.7 since mid-2024. It read 4.2 in September 2026 against 4.7 a year earlier. The failure rate climbed every year from 2022 through 2025: among listings that ended in September, 28% failed in 2023, 42% in 2025 and 45% in 2026.
Sellers kept listing while buyers did not keep pace. New listings rose from 23,351 in 2023 to 28,788 in 2025. Contracts were 17,497 and 17,679.
- New listings
- Contracts
Supply is thinnest at the bottom of the price range (3.4 months under $250,000) and deepest at the top (6.6 months at $2 million and up). The entry-level segment has the county's thinnest inventory and its weakest prices, which points to what its buyers can pay at current rates and to the concessions that close the gap.
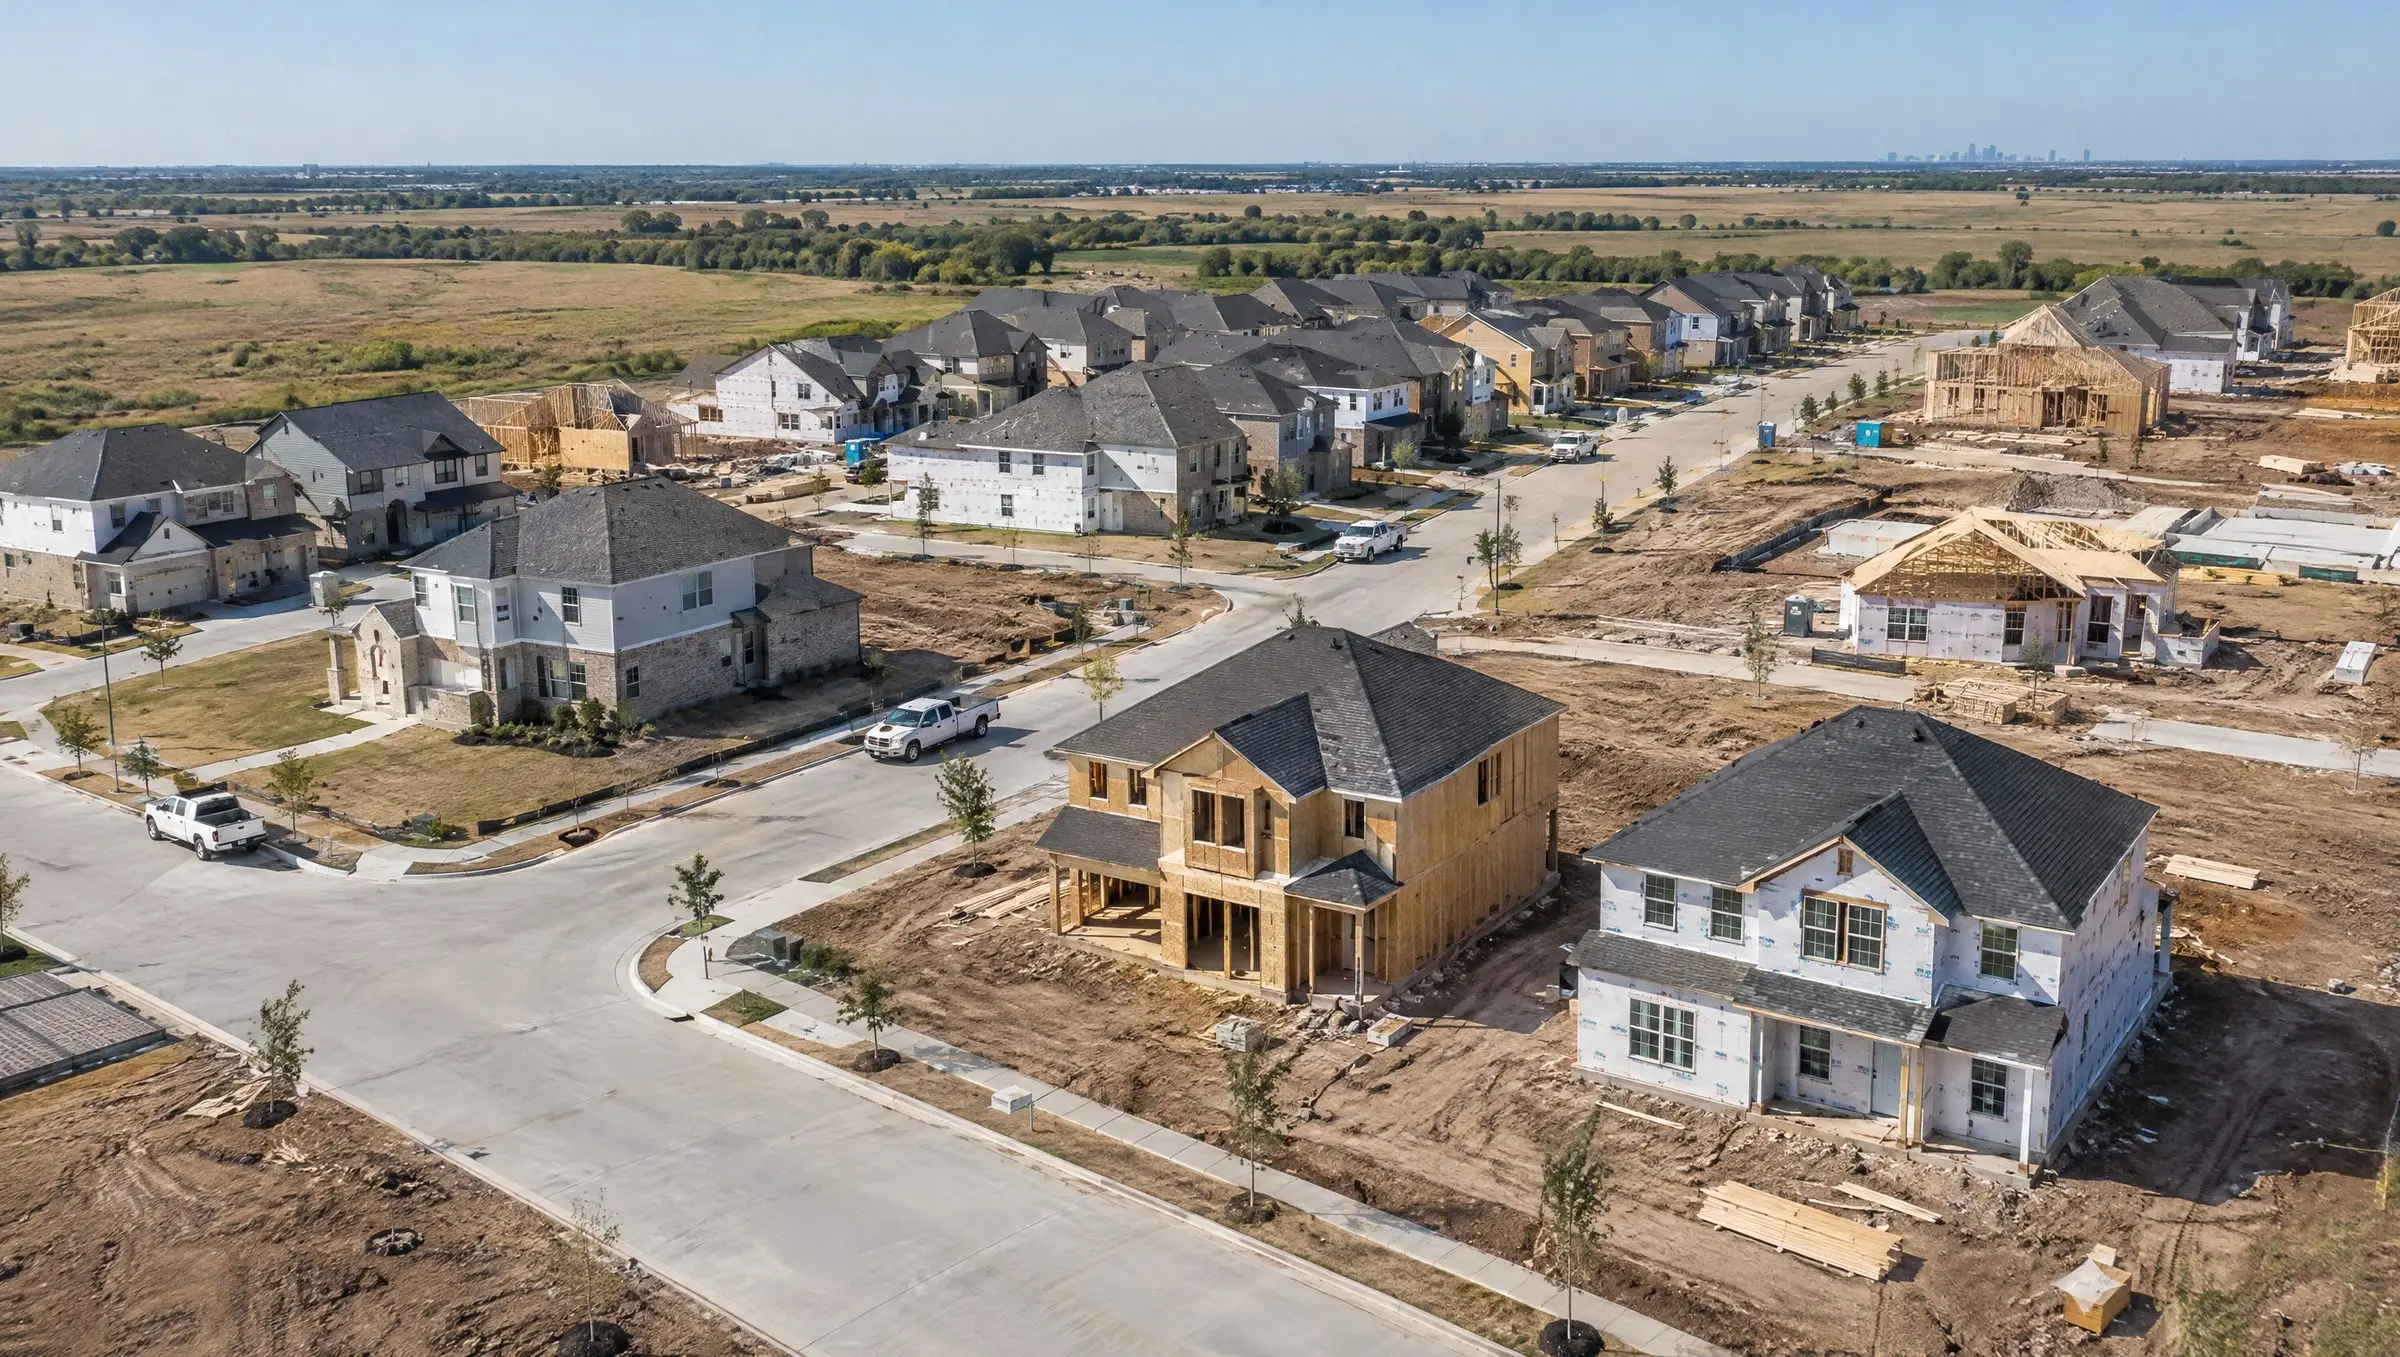
AI-generated illustration of a new subdivision at the edge of the county (Higgsfield)
Builders cut prices to the resale level, in the same zips
Builder sales in the MLS rose from 1,272 in 2021 to 2,243 in 2025. Their median price per square foot fell from $204 in 2022 to $182 in 2026, −11%, while the median new home stayed near 2,205 square feet. The median new home now sells for $386K, close to the $365K median resale.
- New construction
- Resale
Builders also pay more toward closing. 69% of new-home sales in 2026 recorded a seller concession, median $9,418, against 29% in 2021. Rate buydowns arranged through a builder's lender often are not entered in this field, so these figures are a floor. New homes took a median 65 days to sell in 2026, against 24 in 2021.
Builder closings in Mesquite went from 21 in 2021 to 316 in 2025; Seagoville went from 165 in 2021 to 234 in 2025; Balch Springs went from 8 in 2021 to 53 in 2025; Wilmer went from 7 in 2021 to 67 in 2025; Cedar Hill went from 16 in 2021 to 74 in 2025. Those are southern and eastern submarkets where resale prices are weakest, so discounted new homes compete directly with the entry-level resales the low tier is made of.
Rents rose by a third, then stopped for three years
The median closed single-family lease rose from $1,795 a month in Q4 2020 to $2,350 in Q3 2022. It has stayed between $2,200 and $2,400 every quarter since, and was $2,400 in Q3 2026. A fixed segment, three-bedroom homes of 1,200 to 2,000 square feet, shows the same shape at a lower level.
- All single-family leases
- 3 bedrooms, 1,200 to 2,000 sq ft
The lease market loosened the way the sale market did. Closed leases rose from about 1,273 a quarter in 2021 to about 1,931. The median lease took 9 days to fill in Q2 2021 and 26 in Q3 2026, with peaks near 37 in the slower winter quarters. The share of leases signed after a rent cut went from 11% to 35%, and above 50% in late 2025.
Some of the new rental supply comes from owners who could not sell. In each quarter of 2025 and 2026, about one in eight failed sale listings was listed for lease within four months, 419 homes in Q3 2025 alone. That adds rental supply in the same months that buyers step back, which helps explain flat rents.
Flat rents and softer low-tier prices have pushed gross yields up. For a three-bedroom home of 1,200 to 2,000 square feet, a year of median rent equals about 9.1% of the median price, against 8.0% in early 2022. By zip, the yield ranges from about 6% in 75214 and 75209 to about 9% to 10% across southern Dallas; the Rent yield layer on the map shows each zip. Investors who buy in the bottom tier earn more rent per dollar and take on the price path shown in chapter one.
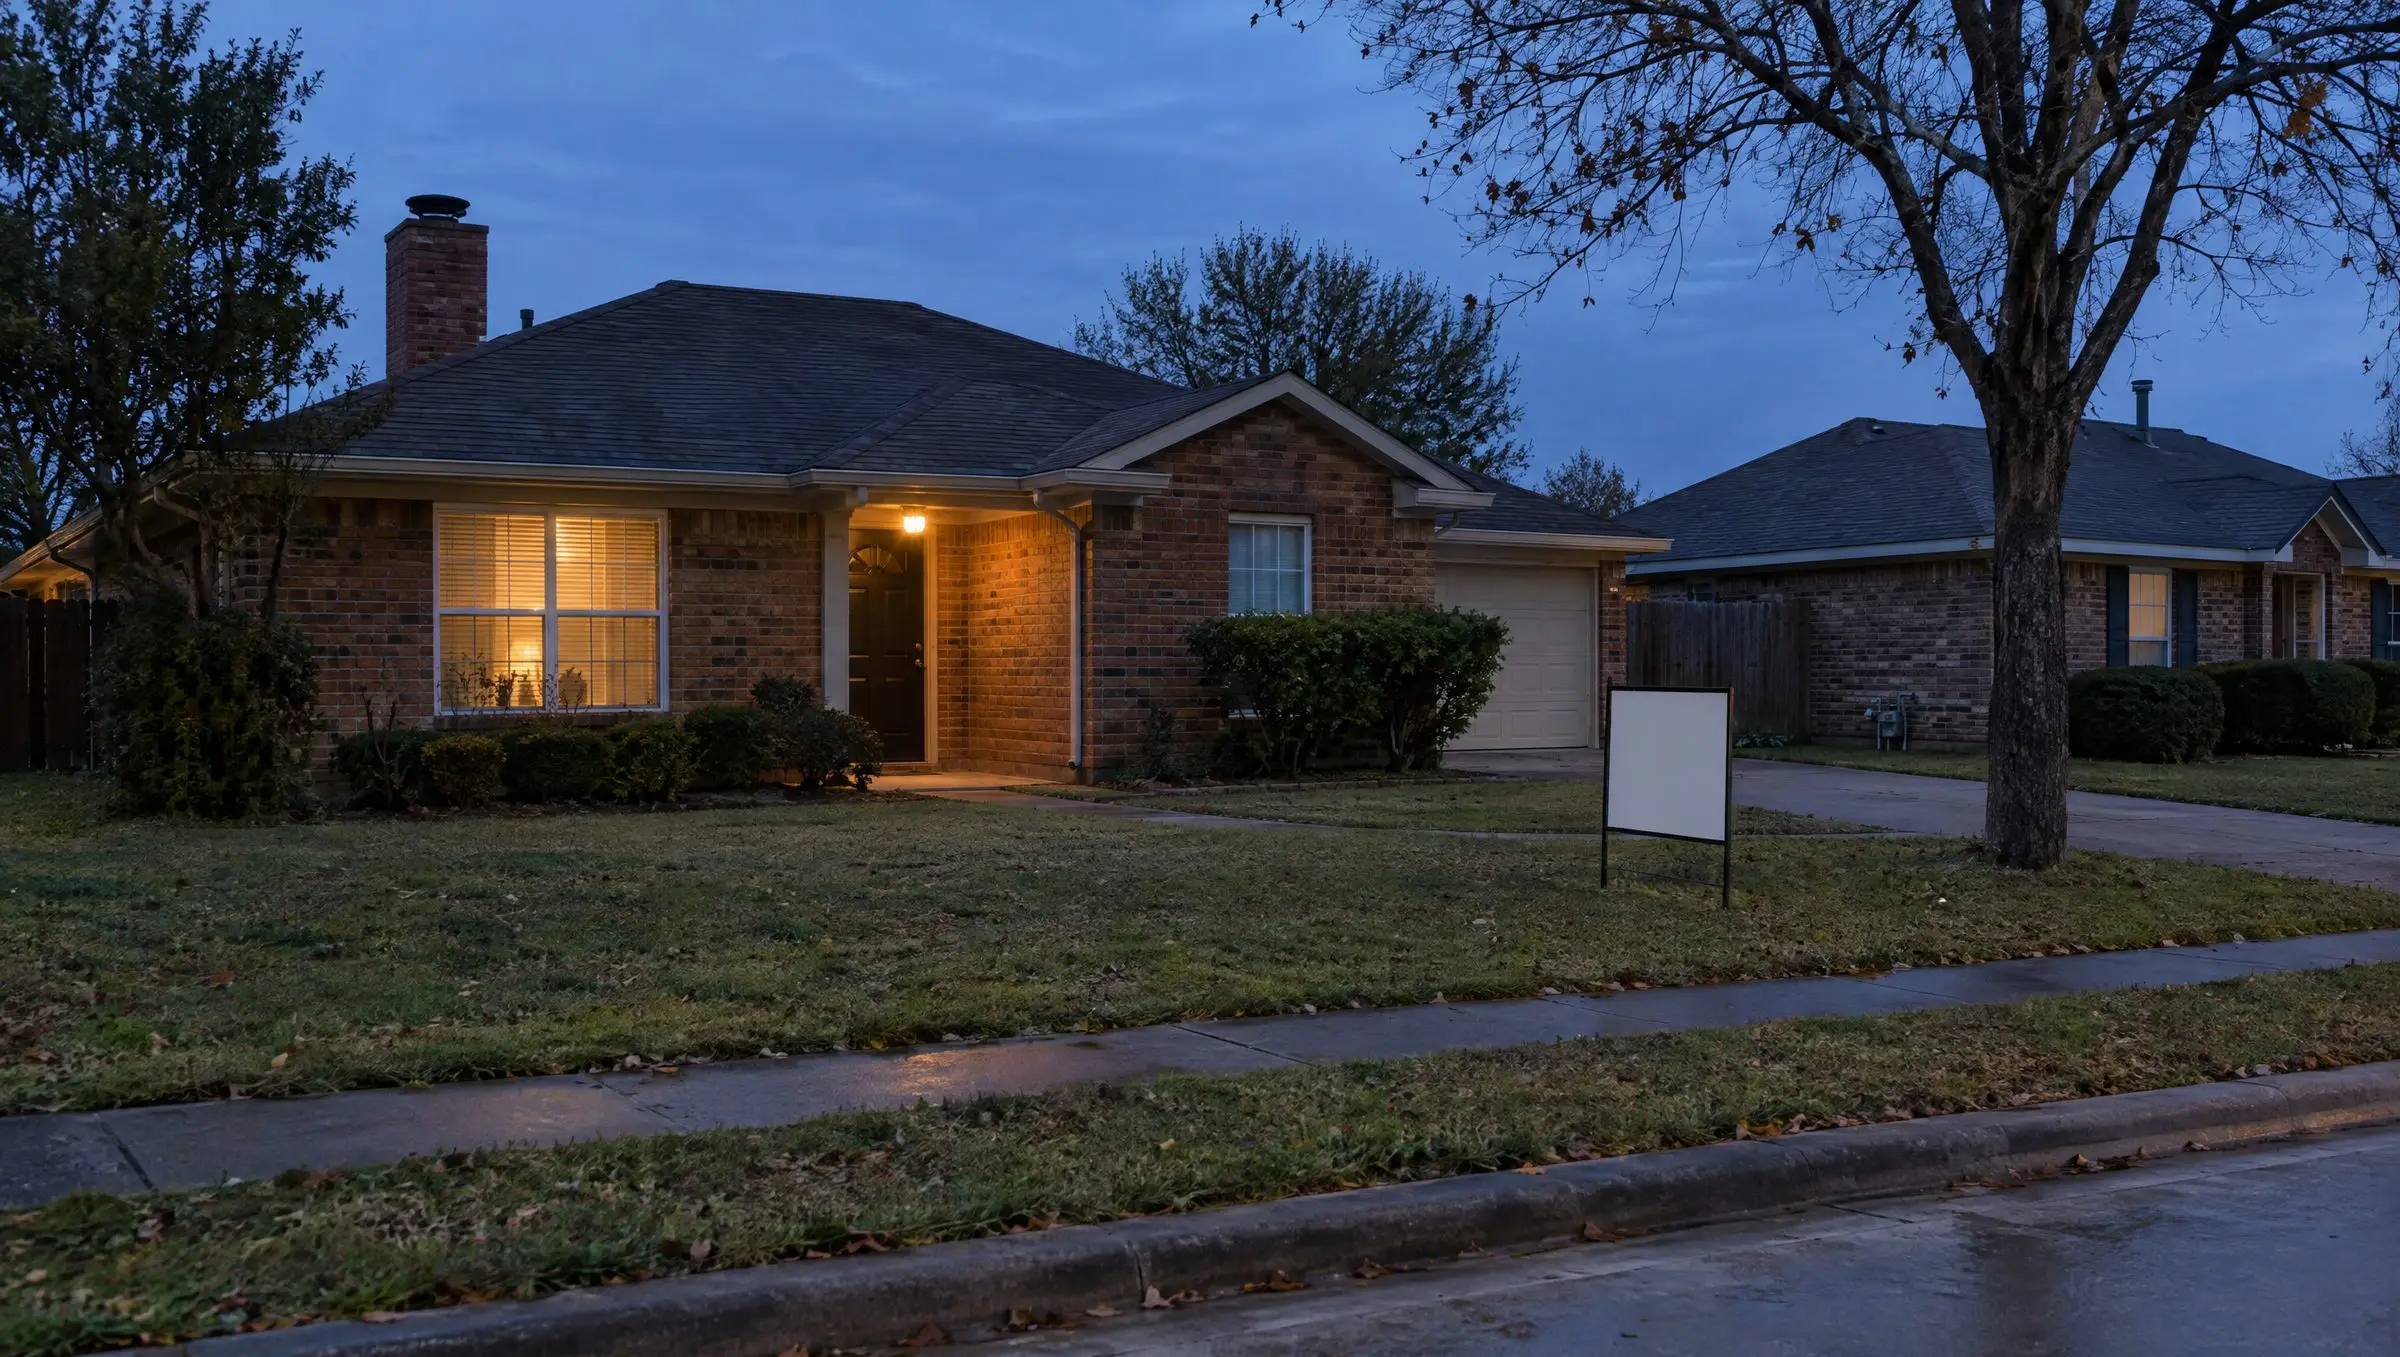
AI-generated illustration of a suburban home with a blank yard sign (Higgsfield)
FHA buyers came back to the tier that fell
At the 2022 peak, cash and conventional buyers outbid everyone else and FHA loans financed only 7.2% of sales. As bidding wars ended, FHA buyers returned: 20% of sales in Q3 2026, and 34% in the median bottom-quarter zip. Many of those loans were made at 3.5% down on homes whose tier has since lost value.
Bank-owned listings remain a small share of the market, 184 in all of 2024 against more than 17,000 closed sales. The count has doubled in two years: 49 new REO listings in Q3 2024, 70 in Q3 2025 and 97 in Q3 2026. Since January 2025 the zips with the most are 75216, 75228, 75149, 75232, 75115, 75217, all in the southern and eastern parts of the county. The bottom quarter of zips holds 237 of them; the top quarter, 51.
The Mortgage Bankers Association reported an FHA delinquency rate of 11.79% for the second quarter of 2026, up 122 basis points from a year earlier, with FHA serious delinquencies up more than 225 basis points, against 2.72% for conventional loans.1 MBA attributes part of the FHA rise to the end of pandemic-era relief options in September 2025.
Summer looked like a floor until rates jumped in September
Through the third quarter, several measures stopped getting worse. From July to September 2026 the failure rate matched 2025, the median sale closed at a slightly higher share of list price, and days on market were a little shorter. Then the 30-year rate in Freddie Mac's weekly survey went from 6.71% on Sept. 3 to 7.40% on Oct. 8 and 15, and 7.32% on Oct. 22.2 Contracts signed in the first nine days of October fell to 363, from 458 in 2025 and 439 in 2024. September contracts, 1,266, were the fewest for that month in the six years of data.
30-year mortgage rate
7.32%6.19% a year earlierFreddie Mac weekly survey, 2026-10-22Contracts signed Oct. 1 to 9
363458 in 2025−21% year over yearMonths of supply
4.24.7 a year earlierSeptember 2026Ended listings that failed
45%42% a year earlierSeptember 2026Sales with concessions
52%49% a year earlierQ3 2026Active listings with a price cut
50%median cut 5%Oct. 24, 2026; sparkline: closed sales with a cutMedian rent, year over year
0.0%$2,400 a monthQ3 2026Bank-owned listings
9770 a year earlierQ3 2026, new listings
At 7.32%, the monthly principal and interest on the median resale with 10% down is about $2,240, close to the 2024 high. Buyers in the bottom tier, where FHA financing and concessions are most common, are the most sensitive to that payment.
The readings to watch through spring 2027 are October and November contracts against prior years, the failure rate on listings that end this winter, concession share in the first quarter, and bank-owned listings in the southern zips. If rates stay above 7%, the most likely result is a longer stretch of soft prices in the low tier and continued strength at the top, with the county average showing little of either.
Reading a Dallas County appraisal or loan file this fall
- 01Use the subject’s tier and zip for the time adjustment
County figures average a rising top third and a falling bottom third. A comparable in a low-tier zip that sold in mid-2022 may need a downward time adjustment of 5% to 10%; the same date in a high-tier zip may need an upward one.
See the data - 02Separate concessions from price
More than half of 2026 sales carried seller-paid concessions, and 80% of FHA resales did. Comparables need the concession amount and an adjustment where the market shows one.
See the data - 03Report listing outcomes, not only closings
About 45% of listings that ended in September failed. Expired and withdrawn listings near the subject show where sellers' expectations sit.
See the data - 04Check new construction nearby
Builders in the southern and eastern submarkets now sell near resale prices with concessions. A resale subject competes with those homes.
See the data - 05Use lease evidence with current marketing times
Lease days on market and rent cuts have doubled since 2021. Rent schedules built on 2022 leases overstate what a lease achieves today.
See the data - 06Watch the bottom tier in collateral reviews
FHA purchases from 2022 to 2024 in the bottom quarter of zips are the loans most likely to have little or no equity.
See the data
A market conditions statement for this county needs its geography. A report that marks values stable based on the county median is accurate for the county as a whole and can be wrong for both a $250,000 home in 75216 and a $900,000 home in 75214. The map in chapter two and the tier index in chapter one are both built from data available to any appraiser with MLS access.
Data: aggregates from MLS exports of Dallas County single-family listings and leases, closings from 2020-10-26 through 2026-10-24: 157,836 sale listings and 110,956 closed sales; 51,487 lease listings and 38,838 closed leases. No addresses, listing numbers or individual sales are published. Zip geography: U.S. Census Bureau 2020 ZIP Code Tabulation Areas, county boundary, interstates and water areas from TIGERweb. Images are AI-generated illustrations made with Higgsfield and do not show specific properties. Research checked Oct. 24, 2026. General information, not lending, legal or investment advice.
Methods and known limits
- Records: listings were deduplicated by listing number, keeping the latest status. A property key built from zip, street number and street name links sales and leases of the same house; parcel numbers in the export were unreliable.
- Repeat-sales index: consecutive closed sales of the same property at least 180 days apart, excluding builder sales, distressed or investor-language first sales, renovation language in the second listing, and changes of more than 10% in living area or more than two years in year built. Fit on quarterly terms with Case-Shiller style weighting by holding period, base Q4 2020 = 100. Tiers are thirds of the first sale's price within its quarter. The text uses two-quarter averages because single quarters rest on a few dozen pairs per tier.
- Zip figures: resales only, living area 500 sq ft or more, zips with 40 or more resales from Oct. 2025 to Sep. 2026. Price change compares median price per sq ft in the twelve months to Sep. 2026 with the twelve months to Sep. 2021. Zip code tabulation areas approximate postal zips and were clipped to the county line.
- Supply: active listings rebuilt from listing, contract and closing dates. Expired and cancelled listings are present only from about the fourth quarter of 2021, so supply and failure series begin in 2022.
- Concessions: the export's seller-paid field. About 0.5% of entries exceed 10% of price and were left out of percentage figures. Builder rate buydowns are often not recorded.
- Rents: closed leases with a monthly rent of $500 to $30,000. Gross yield divides twelve months of median rent by the median resale price for three-bedroom homes of 1,200 to 2,000 sq ft.
- Sale-to-lease switches: a failed sale listing followed by a lease listing for the same property key within 120 days.
- Inflation: figures are nominal. The comparison with consumer prices uses CPI-U, all items, seasonally adjusted, September 2021 to September 2026.
Sources
- Mortgage Bankers Association, Mortgage Delinquencies Decrease Slightly in the Second Quarter of 2026, Aug. 13, 2026
- Freddie Mac, 30-Year Fixed Rate Mortgage Average in the United States (MORTGAGE30US), via FRED, weekly through Oct. 22, 2026
- U.S. Bureau of Labor Statistics, Consumer Price Index for All Urban Consumers: All Items (CPIAUCSL), via FRED, September 2021 and September 2026
- U.S. Census Bureau, TIGERweb: 2020 ZIP Code Tabulation Areas, Dallas County boundary, primary roads and water areas, accessed Oct. 24, 2026
The Signal / Twice-monthly briefing
Follow valuation policy, collateral risk and property technology, with sources.
Unsubscribe in one click. We don't sell your email or share it with sponsors. Privacy Policy