
The Signal / Collateral risk / October 15, 2026
Stable on paperWhat Plano’s leading indicators show that a market-conditions checkbox cannot
Two years of Plano, Texas, MLS data run through the analysis a collateral risk team could use on every loan file: supply, concessions, price cuts, failed listings, distress, financing and a quality-adjusted price index. The appraisal form would call this market stable. The indicators show where it is softening.
On the summary statistics an appraisal report carries, Plano’s single-family market is flat. Months of supply was 3.02, 3.04 and 3.03 across the three windows of the market conditions grid, and the median sale price was $515,000 in the oldest window and in the newest.
Under those numbers, sellers are listing fewer homes, paying larger concessions and cutting asking prices, and two of the city’s six zip codes moved in the opposite direction from the other four. This feature walks through that evidence for collateral risk professionals: what each indicator measures, what it shows in Plano as of mid-October 2026, and what it would take to deliver this depth of market analysis on every loan. It follows our Collin County market monitor, which covered the county as a whole.
National and North Texas reports describe a slower fall market
Four reports released between mid-September and mid-October describe sales slowing, price cuts spreading and prices in the Dallas area slipping below year-earlier levels.
National Association of REALTORS
3.99Mexisting-home sales in September, seasonally adjusted annual rate1
Lawrence Yun: August and September were “the two slowest months for home sales this year.”
Realtor.com
20.8%of active listings had a price cut in September2
Homes under contract fell 4.1% from a year earlier. Redfin counted seller concessions on 53.3% of August sales in Dallas.11
S&P Cotality Case-Shiller
−0.44%Dallas home prices, July 2026 vs a year earlier3
The national index rose 1.9%, and prices fell in real terms for a 14th straight month.
Texas Real Estate Research Center
4.6 moof supply in Dallas-Fort Worth in July4
DFW prices were 0.2% below a year earlier, and sales fell 1.5%.
These are national and metro aggregates. A lender with a loan in Plano needs to know whether the city, and the part of it where the property sits, follows the metro or departs from it. Median prices and closed sales, the numbers headlines lead with, settle only after contracts close. The rest of this article looks at supply, concessions and pricing behavior, which can be measured each month while those contracts are still being written.
The appraisal form reduces the market to three checkboxes
The neighborhood section of the Uniform Residential Appraisal Report characterizes the market with checkboxes. Property values are increasing, stable or declining. Demand and supply are in shortage, in balance or over supply. Marketing time is under three months, three to six months, or over six months. Form 1004MC, the Market Conditions Addendum, adds a grid of sales counts, absorption, listings, months of supply, prices and days on market across three lookback windows.
Fannie Mae stopped requiring Form 1004MC in 2018. Its appraiser newsletter said the change “does not relieve appraisers of reporting market conditions,” and that appraisers “remain responsible for researching, analyzing, and reporting market conditions,” summarized in the neighborhood section.6 UAD 3.6, with a redesigned report, is mandatory for new appraisals submitted on or after November 2, 2026.7 This article does not map the new report’s market fields; our UAD 3.6 coverage follows the transition.
The checkbox, and what sits under it
- The form: values stable, demand and supply in balance, marketing time under three months.
- The grid behind it: months of supply of 3.02, 3.04 and 3.03, and a $515,000 median at both ends.
- The indicators behind the grid: eight measures that moved over the past year.
How often appraisals check each box
FHFA publishes aggregate counts of the checkbox answers on appraisals for loans delivered to Fannie Mae and Freddie Mac. From 2013 through 2023, appraisers marked property values stable on 78.7% to 84.7% of these appraisals nationally in every year except 2021 and 2022, when increasing rose to about 47%. Declining never exceeded 3.71% in a full year. In the third quarter of 2024, the latest in the file, 85.6% checked stable and 0.68% checked declining.5
- Increasing
- Stable
- Declining
Source: FHFA UAD Aggregate Statistics, Enterprise single-family files, data through Q3 2024; shares exclude appraisals with the field missing. The Dallas-Plano-Irving file ends with 2023.5
Data table
| Period | U.S. increasing | U.S. stable | U.S. declining | Dallas-Plano-Irving stable | Dallas-Plano-Irving declining |
|---|---|---|---|---|---|
| 2013 | 16.5% | 81.6% | 1.9% | 90.5% | 0.5% |
| 2014 | 15.5% | 83.5% | 0.9% | 84.3% | 0.3% |
| 2015 | 15.5% | 83.7% | 0.8% | 75.9% | 0.3% |
| 2016 | 18.1% | 81.3% | 0.6% | 72.5% | 0.2% |
| 2017 | 20.2% | 79.4% | 0.5% | 71.9% | 0.3% |
| 2018 | 20.9% | 78.7% | 0.4% | 80.2% | 0.5% |
| 2019 | 14.9% | 84.5% | 0.5% | 89.7% | 0.7% |
| 2020 | 18.7% | 81.0% | 0.3% | 88.9% | 0.4% |
| 2021 | 47.3% | 52.5% | 0.1% | 45.4% | 0.1% |
| 2022 | 46.4% | 52.8% | 0.8% | 37.6% | 0.7% |
| 2023 | 11.6% | 84.7% | 3.7% | 87.2% | 6.2% |
| Q1 2024 | 9.9% | 88.7% | 1.3% | n/a | n/a |
| Q2 2024 | 12.3% | 86.8% | 0.9% | n/a | n/a |
| Q3 2024 | 13.7% | 85.6% | 0.7% | n/a | n/a |
In the Dallas-Plano-Irving metropolitan division, stable ran from 71.9% to 90.5% of appraisals outside 2021 and 2022, and declining reached 6.21% in 2023, its high for the period.5 The checkbox records the appraiser’s conclusion. The evidence behind it stays in the appraiser’s workfile: a reader of the form sees one word and cannot tell whether supply is tight or loose, whether concessions are rising, or which way a price index has moved over two years.

Plano’s market conditions grid supports a stable checkbox
Here is the Form 1004MC grid for Plano single-family sales, effective October 14, 2026. The selector rebuilds it for each zip code and price tier from the same data.
| Window | Sales | Absorption per month | Active listings | Months of supply | Median sale price | Median $/sq ft | Median days on market |
|---|---|---|---|---|---|---|---|
| 7 to 12 months | 1,000 | 166.7 | 503 | 3.02 | $515,000 | $215.8 | 33 |
| 4 to 6 months | 670 | 223.3 | 678 | 3.04 | $564,750 | $221.1 | 17 |
| 0 to 3 months | 529 | 176.3 | 534 | 3.03 | $515,000 | $216.1 | 24 |
| Window | Sales | Absorption per month | Active listings | Months of supply | Median sale price | Median $/sq ft | Median days on market |
|---|---|---|---|---|---|---|---|
| 7 to 12 months | 209 | 34.8 | 94 | 2.70 | $425,000 | $212.6 | 32 |
| 4 to 6 months | 130 | 43.3 | 134 | 3.09 | $465,750 | $216.3 | 16 |
| 0 to 3 months | 110 | 36.7 | 113 | 3.08 | $437,750 | $206.0 | 24 |
| Window | Sales | Absorption per month | Active listings | Months of supply | Median sale price | Median $/sq ft | Median days on market |
|---|---|---|---|---|---|---|---|
| 7 to 12 months | 115 | 19.2 | 70 | 3.65 | $641,150 | $228.6 | 36 |
| 4 to 6 months | 67 | 22.3 | 93 | 4.16 | $728,000 | $229.7 | 15 |
| 0 to 3 months | 65 | 21.7 | 69 | 3.18 | $580,000 | $221.8 | 33 |
| Window | Sales | Absorption per month | Active listings | Months of supply | Median sale price | Median $/sq ft | Median days on market |
|---|---|---|---|---|---|---|---|
| 7 to 12 months | 185 | 30.8 | 99 | 3.21 | $560,000 | $205.8 | 32 |
| 4 to 6 months | 137 | 45.7 | 120 | 2.63 | $590,000 | $207.4 | 23 |
| 0 to 3 months | 80 | 26.7 | 95 | 3.56 | $550,000 | $200.2 | 30 |
| Window | Sales | Absorption per month | Active listings | Months of supply | Median sale price | Median $/sq ft | Median days on market |
|---|---|---|---|---|---|---|---|
| 7 to 12 months | 162 | 27.0 | 76 | 2.81 | $377,000 | $203.6 | 35 |
| 4 to 6 months | 87 | 29.0 | 112 | 3.86 | $399,600 | $205.7 | 20 |
| 0 to 3 months | 71 | 23.7 | 99 | 4.18 | $375,000 | $206.3 | 21 |
| Window | Sales | Absorption per month | Active listings | Months of supply | Median sale price | Median $/sq ft | Median days on market |
|---|---|---|---|---|---|---|---|
| 7 to 12 months | 156 | 26.0 | 81 | 3.12 | $488,500 | $212.6 | 30 |
| 4 to 6 months | 107 | 35.7 | 112 | 3.14 | $500,000 | $219.8 | 15 |
| 0 to 3 months | 95 | 31.7 | 78 | 2.46 | $477,900 | $218.7 | 20 |
| Window | Sales | Absorption per month | Active listings | Months of supply | Median sale price | Median $/sq ft | Median days on market |
|---|---|---|---|---|---|---|---|
| 7 to 12 months | 169 | 28.2 | 82 | 2.91 | $765,000 | $248.7 | 35 |
| 4 to 6 months | 138 | 46.0 | 105 | 2.28 | $857,500 | $258.7 | 13 |
| 0 to 3 months | 106 | 35.3 | 78 | 2.21 | $788,000 | $257.3 | 20 |
| Window | Sales | Absorption per month | Active listings | Months of supply | Median sale price | Median $/sq ft | Median days on market |
|---|---|---|---|---|---|---|---|
| 7 to 12 months | 351 | 58.5 | 125 | 2.14 | $375,000 | $205.0 | 34 |
| 4 to 6 months | 182 | 60.7 | 188 | 3.10 | $382,500 | $205.4 | 17 |
| 0 to 3 months | 179 | 59.7 | 139 | 2.33 | $380,000 | $208.9 | 26 |
| Window | Sales | Absorption per month | Active listings | Months of supply | Median sale price | Median $/sq ft | Median days on market |
|---|---|---|---|---|---|---|---|
| 7 to 12 months | 482 | 80.3 | 253 | 3.15 | $555,000 | $215.7 | 33 |
| 4 to 6 months | 319 | 106.3 | 357 | 3.36 | $575,000 | $215.1 | 18 |
| 0 to 3 months | 262 | 87.3 | 295 | 3.38 | $550,000 | $211.8 | 24 |
| Window | Sales | Absorption per month | Active listings | Months of supply | Median sale price | Median $/sq ft | Median days on market |
|---|---|---|---|---|---|---|---|
| 7 to 12 months | 167 | 27.8 | 125 | 4.49 | $995,000 | $260.0 | 33 |
| 4 to 6 months | 169 | 56.3 | 133 | 2.36 | $949,000 | $261.1 | 16 |
| 0 to 3 months | 88 | 29.3 | 100 | 3.41 | $999,997 | $266.7 | 22 |
Windows are months before the effective date: 7 to 12, 4 to 6, and 0 to 3. Months of supply is active listings divided by monthly absorption. Bars show months of supply on a 0 to 5 scale.
For the whole city, months of supply is 3.02, 3.04 and 3.03, and the median sale price is $515,000 in the oldest window and in the newest. An appraiser completing this grid would reasonably check stable values, a market in balance and marketing time under three months, and the answer is defensible on the data in the grid.
Months of supply in the current window runs from 2.21 in 75093 to 4.18 in 75074. Each window also mixes season with trend, because Plano’s prices rise in spring and fall back in autumn. The year-over-year comparisons in chapter 04 and the regression in chapter 06 separate the two.
Six indicators that move before the median price
Each comparison below sets the trailing 12 months, October 2025 through September 2026, against the 12 months before, unless a chart says otherwise. October 2026 runs only through October 14 and is drawn dashed or hollow.
4.1 Supply is falling faster than demand
New listings fell 9.5%, from 3,584 to 3,244, while contracts written fell 4.1%, from 2,352 to 2,256. In the first two weeks of October, new listings ran 32% below the same weeks of 2025 (86 against 126), while contracts were slightly higher (83 against 78).
- New listings
- Contracts written
October 2026 (dashed) runs through Oct. 14. Contracts written include closed, pending and contingent listings and listings that ended after a contract date.
Active listings on October 14 numbered 534, down 27.5% from 737 a year earlier. Months of supply at the end of September was 3.20, down from 3.72. Demand fell too: contracts written in the third quarter were 13% below the third quarter of 2025 (543 against 624). When supply and demand shrink together, months of supply stays flat, which is what the grid showed. With fewer sellers and fewer buyers, a rate change or a local employer announcement can move a larger share of the market.
4.2 Sellers are paying more to close
- 47.0% → 49.6%closings with seller-paid costs
- $5,000 → $6,800median concession when one was paid, up 36%
- 11.4% → 15.2%closings with concessions of 2% of price or more
- 0.52% → 0.65%concessions as a share of dollar volume
Concessions matter to collateral value because the contract price overstates what the seller nets. Median gross price per square foot fell 1.2% over the trailing year, from $220 to $218. After subtracting seller-paid costs, the median net price per square foot fell 1.6%, from $219 to $215. A comparable grid that adjusts each sale for concessions catches part of this. A market conditions conclusion built on median sale price misses it.
- Prior 12 months
- Trailing 12 months
4.3 List-to-sale spreads and price cuts
The median sale-to-original-list ratio slipped from 97.3% to 96.8%. Sales closing below 90% of original list rose from 13.2% to 14.2%, sales above list fell from 17.6% to 15.7%, and median cumulative days on market rose from 26 to 29.
The third-quarter comparison runs the other way: the ratio rose from 96.1% to 96.9% and cumulative days on market fell from 34 to 26, because the third quarter of 2025 was weak. Reading each indicator on more than one window keeps a single favorable comparison from setting the conclusion.
- Sale to final list
- Sale to original list
The shaded gap is the spread between the two ratios. October 2026 is omitted from the lines because it covers two weeks.
The active inventory carries the forward signal. As of October 15, 58.5% of active listings had cut their price, with a median cut of 4.4%; 48.8% had changed price in the last 30 days, and 29.7% had been listed more than 90 days. The export records original and current list price but not the number of price changes, so it cannot show whether sellers made one cut or several.
4.4 More listings fail to sell
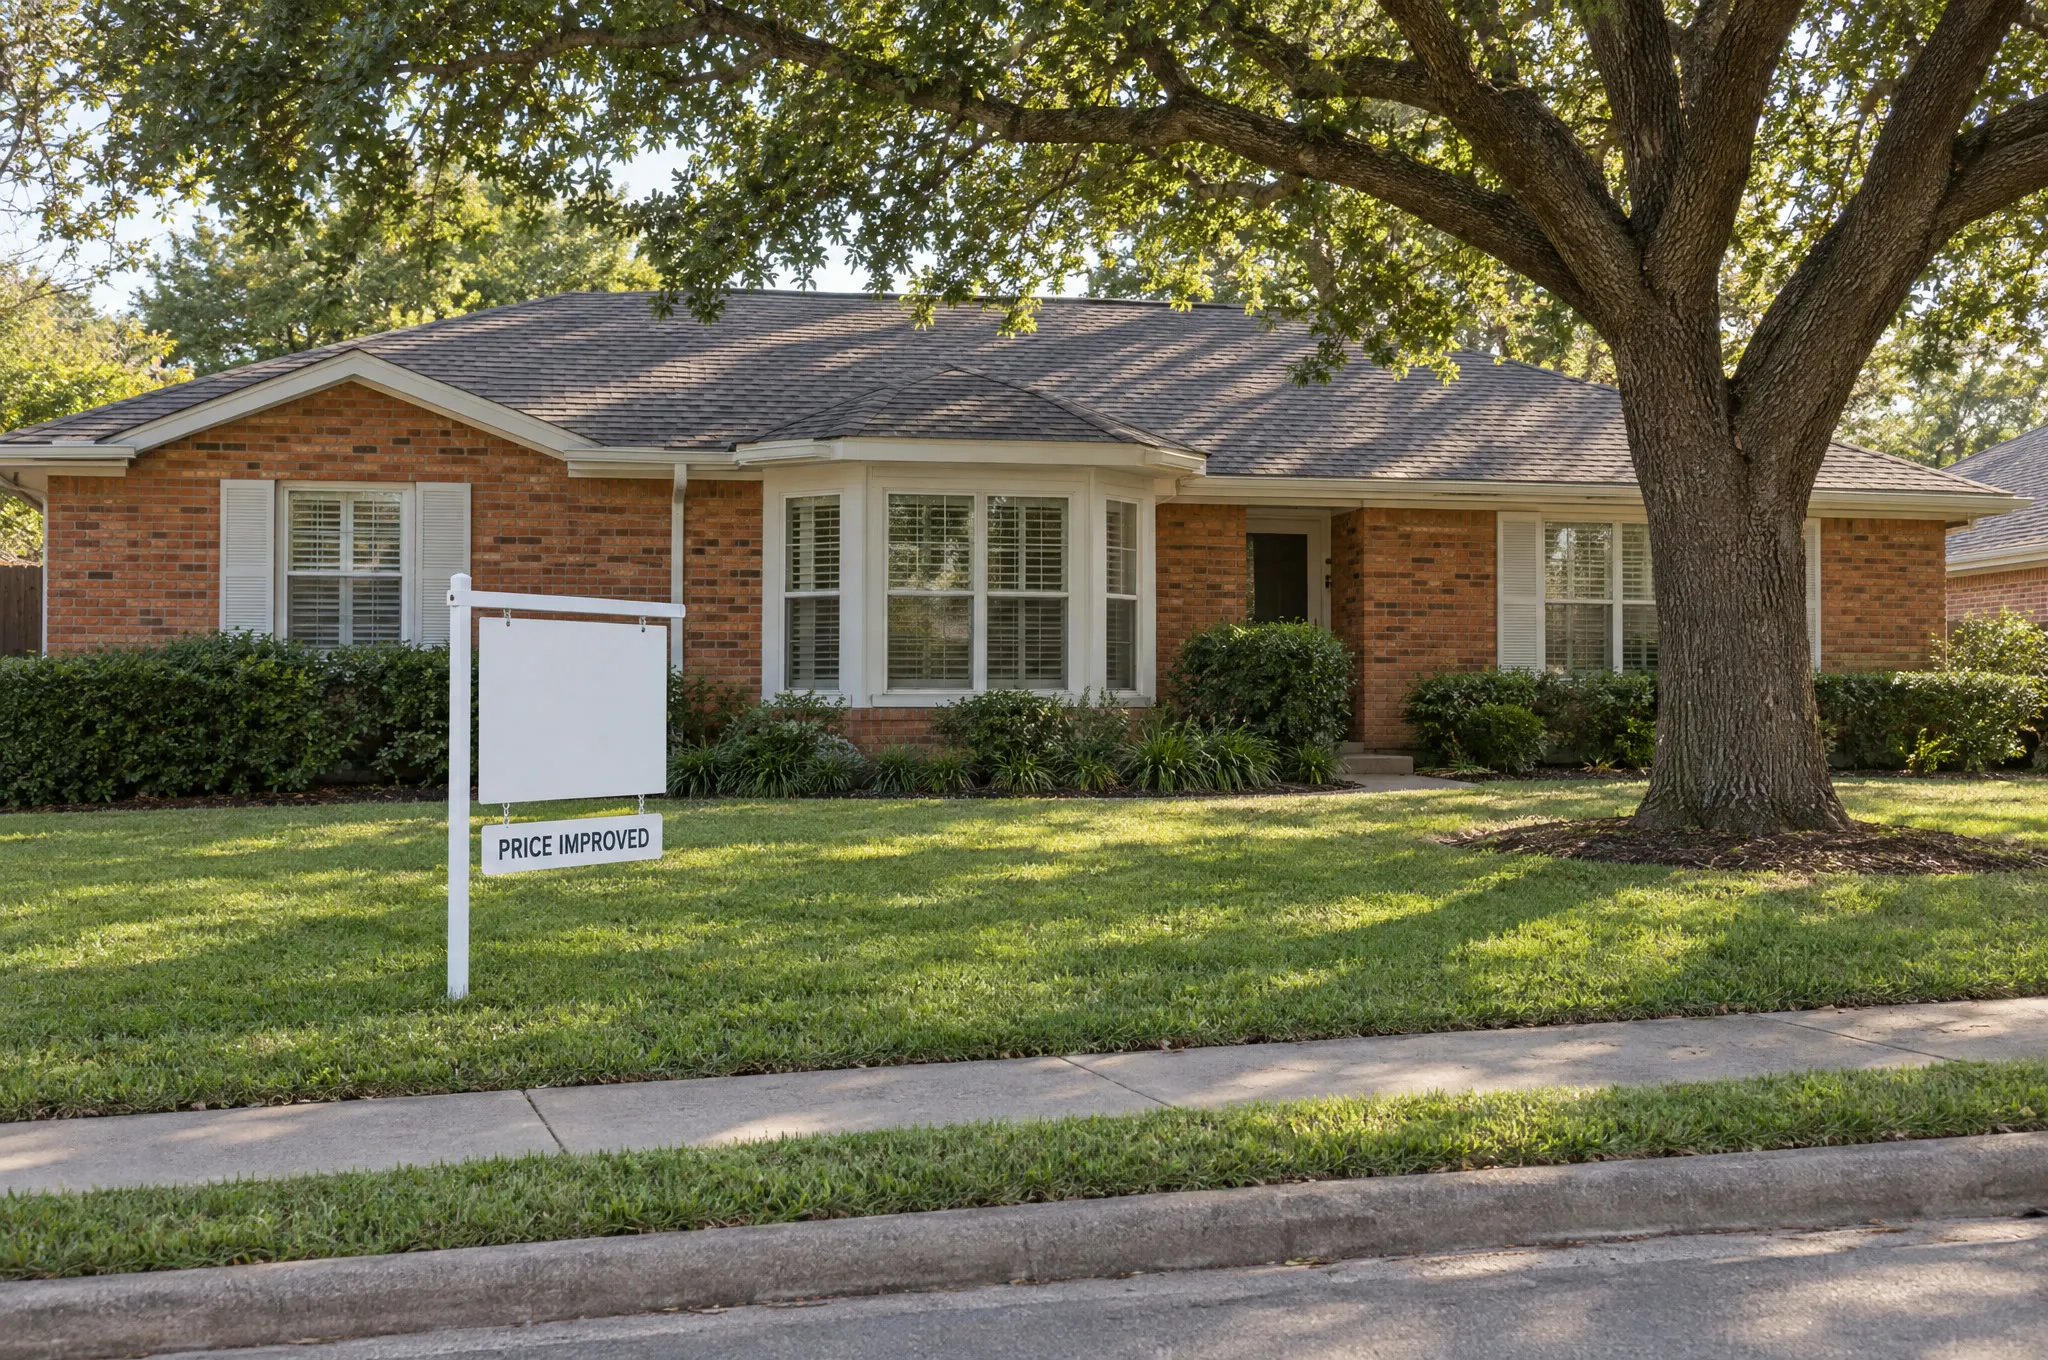
Listings that ended cancelled, expired or withdrawn rose 5.9%, from 1,109 to 1,174. Contracts that fell through rose from 11 in the third quarter of 2025 to 18 in the third quarter of 2026, a count small enough to read as a direction. When failed listings rise while inventory falls, sellers who will not meet buyers’ prices are leaving the market. That supports prices in the short run and leaves fewer sales for an appraiser to use.
4.5 Distress is rising from a very low base
Distressed sales (REO, HUD, short sale, third-party approval, foreclosure, notice of default, auction and bankruptcy) were 20 of 2,224 closings over the trailing year, 0.9%, up from 12, or 0.5%. REO and HUD closings rose from 5 to 13. The first quarter of 2026 was the high point, with 8 distressed closings, 1.8% of the quarter. Seven of 535 active listings carry a distress flag. At under 1% of sales, distressed transactions are not setting prices in Plano, and the count is worth reading each quarter.
4.6 How buyers pay, and where
Financing was steady over the trailing year: 66.9% conventional, 19.4% cash, 5.9% FHA and 3.5% VA. Cash rose to 20.8% of closings in the third quarter of 2026 from 18.3% a year earlier. The mix varies more by segment than over time. FHA financed 10% of sales under $450,000 and none above $750,000. Zip 75074 had the highest FHA share, 11%, and 75093 the highest cash share, 25%. A rising cash share in an entry-level segment can point to investor buying, and a rising FHA share can point to buyers moving down-market.
- Conventional
- Cash
- FHA
- VA
- Other
The October 2026 bar covers 56 closings and is shown faded.

Four zip codes lost value per square foot and two gained
West Plano’s 75093 held value with the tightest supply in the city: median price per square foot rose 1.7%, and months of supply was 2.2. Zip 75025 lost 4.0% and had the longest cumulative days on market, 35. Zip 75074 in east Plano had the most supply, 3.7 months. An appraiser in 75025 and an appraiser in 75093 are describing different markets under the same city name.
Choose a zip code
Schematic, not to scale; zip boundaries and road lines are approximate. Hatched tiles declined.
Central Plano
Zip 75023
- Closings, trailing 12 months
- 459 (−8.0% vs prior)
- Median price per sq ft
- $211.1 (−2.8%)
- Sale to original list
- 97.1%
- Cumulative days on market
- 29 (was 24)
- Closings with concessions
- 50%
- Months of supply
- 3.0
- Active listings with a price cut
- 57.4%
- Failed-listing rate
- 34%
Time adjustment, annualized, with 95% interval
Northwest Plano
Zip 75024
- Closings, trailing 12 months
- 252 (+1.6% vs prior)
- Median price per sq ft
- $226.3 (−0.5%)
- Sale to original list
- 96.4%
- Cumulative days on market
- 33 (was 37)
- Closings with concessions
- 51%
- Months of supply
- 3.3
- Active listings with a price cut
- 49.3%
- Failed-listing rate
- 36%
Time adjustment, annualized, with 95% interval
North Plano
Zip 75025
- Closings, trailing 12 months
- 407 (+6.8% vs prior)
- Median price per sq ft
- $205.5 (−4.0%)
- Sale to original list
- 96.4%
- Cumulative days on market
- 35 (was 30)
- Closings with concessions
- 53%
- Months of supply
- 2.8
- Active listings with a price cut
- 61.1%
- Failed-listing rate
- 39%
Time adjustment, annualized, with 95% interval
East Plano
Zip 75074
- Closings, trailing 12 months
- 321 (−9.3% vs prior)
- Median price per sq ft
- $205.4 (−0.7%)
- Sale to original list
- 96.7%
- Cumulative days on market
- 32 (was 30)
- Closings with concessions
- 46%
- Months of supply
- 3.7
- Active listings with a price cut
- 64.3%
- Failed-listing rate
- 35%
Time adjustment, annualized, with 95% interval
South central Plano
Zip 75075
- Closings, trailing 12 months
- 357 (+1.4% vs prior)
- Median price per sq ft
- $216.0 (+1.2%)
- Sale to original list
- 97.4%
- Cumulative days on market
- 24 (was 25)
- Closings with concessions
- 53%
- Months of supply
- 2.6
- Active listings with a price cut
- 62.8%
- Failed-listing rate
- 37%
Time adjustment, annualized, with 95% interval
West and southwest Plano
Zip 75093
- Closings, trailing 12 months
- 416 (−2.4% vs prior)
- Median price per sq ft
- $254.1 (+1.7%)
- Sale to original list
- 97%
- Cumulative days on market
- 26 (was 18)
- Closings with concessions
- 45%
- Months of supply
- 2.2
- Active listings with a price cut
- 52.6%
- Failed-listing rate
- 27%
Time adjustment, annualized, with 95% interval
Price tiers and housing age
Price tiers split the same way. Homes above $750,000 gained 4.0% in median price per square foot. Homes under $450,000 lost 2.1%, and the $450,000 to $750,000 tier lost 1.9% while carrying the heaviest concession use in the city, 55% of closings. Homes built in 2000 or later had 15% fewer closings, 4.5 months of supply at the trailing pace and a failed-listing rate of 44%, the highest of any segment.
Change in median $/sq ft
Closings with concessions
Months of supply
School district cuts are possible with this export. Frisco ISD homes inside Plano had a higher concession rate than Plano ISD homes, 57% against 50%. The export has no elementary attendance zone; adding that field would allow the same comparison at the attendance-zone level.
Measuring the time adjustment instead of asserting it
The market conditions conclusion should support the time adjustment in the sales comparison grid. Comparing median prices across windows mixes seasonality, home size and location with price change. A hedonic regression controls for those. This one regresses the log of sale price on living area, age, bathrooms, bedrooms, pool, lot size, garage spaces, zip code and month of sale across 4,496 sales, and explains 86% of the variation in price. The month coefficients form a constant-quality price index.
Model specification
Ordinary least squares on 4,496 sales closed October 2024 through September 2026. Dependent variable: log of close price. Controls: log living area, age and age squared, baths (full plus half at 0.5), bedrooms, pool, log lot size (capped at 1,000 to 200,000 sq ft), garage spaces (capped at 4), zip code fixed effects and month fixed effects. Robust (HC1) standard errors. R² 0.86. The window rates below replace the month effects with a linear time term, estimated separately by segment.
Constant-quality prices rose to 103.8 in March 2025, fell to 96.6 by September 2025, recovered to 101.9 in June 2026 and returned to 96.5 in September 2026. Plano’s constant-quality prices swing roughly 5% to 7% from spring peak to fall low, and September 2026 sits within a tenth of a point of September 2025.
The window chooses the answer
- Last 24 months
- Last 12 months
Intervals are the monthly 95% bounds compounded to a year. Rows with fewer sales, such as 75024 and the $750,000-plus tier, have wider intervals.
Over the last 24 months, Plano prices declined 1.3% a year, with a 95% interval of −2.1% to −0.4%: a measurable decline. Over the last 12 months, prices rose 1.8% a year, with an interval of −0.6% to +4.3% that includes zero, and that window starts at a seasonal low, which biases the trend upward. By zip code, the 24-month rate runs from −3.4% a year in 75024 and 75025 to +1.2% in 75093.
A single median-to-median comparison picks one of these answers and hides the others. An analysis written for risk use shows the rate, the interval and the window, so the appraiser and the underwriter can see how sensitive the conclusion is.


What the analysis says about Plano
- Supply is falling faster than demand, which holds months of supply near three.
- Sellers are absorbing the softness through concessions and price cuts, and net prices fell more than gross prices.
- Constant-quality prices are level with a year earlier in September and down about 1.3% a year over two years.
- Distress is rising from a low base and remains under 1% of sales.
- Four zip codes declined 2.6% to 3.4% a year over 24 months; 75075 and 75093 held.
AI-generated time-lapse of a fictional neighborhood
A market file a collateral risk team could use
The indicators to watch in Plano over the next two quarters are the concession rate and size, the share of active listings with price cuts, and whether new listings stay below contracts into spring 2027. If concessions keep rising while new listings recover, the evidence for a stable checkbox weakens.
A collateral risk team can only watch those indicators if it receives them. The panel below assembles, for any Plano zip code, the market evidence this article computed, in a form that could travel with an appraisal. It is an illustration: the figures are real zip-level aggregates, and no property or report is shown.
What the report carries today
- Property valuesStable
- Demand and supplyIn balance
- Marketing timeUnder 3 months
Plus a grid of medians and counts, where an addendum is included.
A market file for
- Time adjustment, 24 months
- −2.6% a year 95% interval −4.0% to −1.1%
- Seller concessions
- 50% of closings, median $8,000
- Price cuts on active listings
- 57.4% of 115 active listings, median cut 4.5%
- Supply
- 3.0 months at the trailing 12-month pace
- Failed listings
- 34% of listings that ended
- Cumulative days on market
- 29 days median, 24 a year earlier
- Distress
- 0 active listings flagged
- Indicators to monitor
- Concession rate and median, share of listings with price cuts, new listings against contracts
- Appraiser’s conclusion
- Written by the appraiser for the subject’s competitive market, citing the indicators above
- Time adjustment, 24 months
- −3.4% a year 95% interval −6.3% to −0.4%
- Seller concessions
- 51% of closings, median $6,576
- Price cuts on active listings
- 49.3% of 69 active listings, median cut 4.3%
- Supply
- 3.3 months at the trailing 12-month pace
- Failed listings
- 36% of listings that ended
- Cumulative days on market
- 33 days median, 37 a year earlier
- Distress
- 0 active listings flagged
- Indicators to monitor
- Concession rate and median, share of listings with price cuts, new listings against contracts
- Appraiser’s conclusion
- Written by the appraiser for the subject’s competitive market, citing the indicators above
- Time adjustment, 24 months
- −3.4% a year 95% interval −4.6% to −2.0%
- Seller concessions
- 53% of closings, median $5,000
- Price cuts on active listings
- 61.1% of 95 active listings, median cut 4.6%
- Supply
- 2.8 months at the trailing 12-month pace
- Failed listings
- 39% of listings that ended
- Cumulative days on market
- 35 days median, 30 a year earlier
- Distress
- 3 active listings flagged
- Indicators to monitor
- Concession rate and median, share of listings with price cuts, new listings against contracts
- Appraiser’s conclusion
- Written by the appraiser for the subject’s competitive market, citing the indicators above
- Time adjustment, 24 months
- −2.8% a year 95% interval −4.6% to −1.1%
- Seller concessions
- 46% of closings, median $7,085
- Price cuts on active listings
- 64.3% of 98 active listings, median cut 3.5%
- Supply
- 3.7 months at the trailing 12-month pace
- Failed listings
- 35% of listings that ended
- Cumulative days on market
- 32 days median, 30 a year earlier
- Distress
- 2 active listings flagged
- Indicators to monitor
- Concession rate and median, share of listings with price cuts, new listings against contracts
- Appraiser’s conclusion
- Written by the appraiser for the subject’s competitive market, citing the indicators above
- Time adjustment, 24 months
- +0.7% a year 95% interval −1.3% to +2.7%
- Seller concessions
- 53% of closings, median $7,000
- Price cuts on active listings
- 62.8% of 78 active listings, median cut 4.6%
- Supply
- 2.6 months at the trailing 12-month pace
- Failed listings
- 37% of listings that ended
- Cumulative days on market
- 24 days median, 25 a year earlier
- Distress
- 1 active listing flagged
- Indicators to monitor
- Concession rate and median, share of listings with price cuts, new listings against contracts
- Appraiser’s conclusion
- Written by the appraiser for the subject’s competitive market, citing the indicators above
- Time adjustment, 24 months
- +1.2% a year 95% interval −1.0% to +3.4%
- Seller concessions
- 45% of closings, median $6,750
- Price cuts on active listings
- 52.6% of 78 active listings, median cut 5.7%
- Supply
- 2.2 months at the trailing 12-month pace
- Failed listings
- 27% of listings that ended
- Cumulative days on market
- 26 days median, 18 a year earlier
- Distress
- 1 active listing flagged
- Indicators to monitor
- Concession rate and median, share of listings with price cuts, new listings against contracts
- Appraiser’s conclusion
- Written by the appraiser for the subject’s competitive market, citing the indicators above
None of these calculations is new. Absorption, months of supply, list-to-sale ratios, concession rates, failed-listing rates, segment comparisons and hedonic indices are standard tools in valuation and economics, and everything in this article came from one MLS export. What remains is producing this file on every loan and training people on the lender’s side to read it.
Delivering this analysis on every loan needs a trained workforce

An appraiser on a residential assignment pulls comparables, inspects, adjusts, reconciles and writes the report within the agreed fee and turn time. A multi-indicator market study with segment cuts and a regression-based time adjustment does not fit inside that workflow when it is built by hand, so the form gets three checkboxes and a grid.
The pool of credentialed appraisers is smaller than it was. The ASC’s National Registry held more than 121,000 appraiser credentials at its 2007 peak.8 The registry export copied by our Appraiser Finder on October 11, 2026 lists 87,520 active credentials, 5,530 of them issued by Texas.9 These are credentials, and one appraiser can hold licenses in several states, so the number of people is lower.
28% fewer credentials than the 2007 peak
Sources: ASC testimony, July 13, 2011; ASC National Registry export, Oct. 11, 2026.89
Residential Market Analysis and Highest and Best Use: 15 of 158 hours
Source: AQB required core curriculum for applicants from Jan. 1, 2026. Certified credentials add hours and experience.10
Market analysis is a small share of the path to a license: since Jan. 1, 2026, the core curriculum for a Licensed Residential appraiser has required 158 hours of qualifying education, and one 15-hour course covers residential market analysis and highest and best use.10 We found no national data on how many appraisers, reviewers or collateral risk analysts are trained to build and explain the kind of analysis in this article.
What delivering it at scale would take
- 01Data pipelines
MLS, public record and listing-history data refreshed for every market where loans are made, with the same rules for relists, leases and data-entry errors.
- 02A standard indicator set
The same leading indicators computed the same way for every neighborhood, segment and price tier, so a reader in Plano and a reader in Phoenix compare like with like.
- 03Statistical time adjustments
Quality-adjusted indices with intervals by segment, in place of median-to-median comparisons.
- 04A trained workforce
Appraisers with deeper market analysis training who decide which indicators apply to the subject’s competitive market and explain the conclusion; reviewers and collateral risk analysts who can question it; and a training path that teaches both.
Software can produce the first three. The fourth is a workforce question: who is trained to interpret a concession trend, a failed-listing rate or a confidence interval, and to write it in terms a credit decision can use. Lenders, investors and the GSEs make credit decisions with the market conclusion today. A stable designation in a market where concessions are rising and net prices are falling can understate risk, and a declining designation applied to a whole city while two of its zip codes are rising can overstate it.
For Plano, the concession rate, the share of listings with price cuts and the balance of new listings against contracts are the numbers to check in spring 2027.
Data: aggregates from an MLS export of Plano single-family listings with a status change from Aug. 26, 2024 through Oct. 15, 2026: 7,979 listings after de-duplication and 4,771 closed sales. Duplicate listings were removed, lease-priced records excluded, and concession values above 15% of price treated as data-entry errors. October 2026 figures run through Oct. 14. Segments with few sales move with a handful of transactions. The market file in chapter 07 is an illustration built from zip-level aggregates and shows no real property. Images and video were generated with Higgsfield as illustrations of a fictional neighborhood; the charts and the hero’s price line are drawn in code from the data. Research checked Oct. 15, 2026. General information, not lending, legal or investment advice.
Definitions and known limits
- Months of supply: month-end active listings divided by the trailing three-month average of closings; in segment tables, active listings today divided by average monthly closings over the trailing 12 months.
- Contracts written: listings with a purchase contract date in the period, including listings that later ended cancelled or expired.
- Failed listings: listings that ended cancelled, expired or withdrawn, dated by status change. The failed-listing rate divides them by failed listings plus closings.
- Distress: REO or bank owned, HUD owned, short sale, third-party approval, in foreclosure, notice of default, auction or bankruptcy in the listing’s special conditions.
- Inventory history is reconstructed from final listing records, so a listing that went under contract and returned to active under the same MLS number appears once; fall-through counts are understated for the same reason.
- No price-change history: the export holds original and current list price and the last change date.
- Seasonality: any comparison of adjacent quarters, including the 1004MC windows, mixes season with trend. Year-over-year comparisons and the 24-month regression are the more reliable reads.
- Gross and net price per square foot come from the concession analysis sample and differ slightly from the scorecard medians.
Sources
11 documents and datasets, accessed Oct. 15, 2026
- National Association of REALTORS, Existing-Home Sales, September 2026Oct. 13, 2026
- Realtor.com Economic Research, September 2026 Housing Trends: Rates Top 7%, Price Cuts SurgeSept. 30, 2026
- S&P Dow Jones Indices, S&P Cotality Case-Shiller Index Reports Annual Gain in July 2026Sept. 29, 2026
- Texas Real Estate Research Center at Texas A&M University, Texas Housing Insight, September 2026 (July data)Sept. 18, 2026
- Federal Housing Finance Agency, Uniform Appraisal Dataset Aggregate Statistics, Enterprise single-family national and metro files (v3.3)Data through Q3 2024
- Fannie Mae, Appraiser Update: Fannie Mae No Longer Requires Form 1004MCSeptember 2018
- Freddie Mac, UAD and Forms Redesign FAQsAccessed Oct. 15, 2026
- Statement of James R. Park, Executive Director, Appraisal Subcommittee, before the House Financial Services Subcommittee on Insurance, Housing and Community OpportunityJuly 13, 2011
- Appraisal Subcommittee, National Registry export, as copied by The Signal’s Appraiser FinderOct. 11, 2026
- Appraisal Qualifications Board, New Education Requirements to the Real Property Appraiser Qualification Criteria, Effective January 1, 2026 (as published by the Alabama Real Estate Appraisers Board)January 2026
- Redfin, Nearly Half of U.S. Homebuyers Get Concessions From SellersSept. 18, 2026
The Signal / Monthly briefing
Follow valuation policy, collateral risk and property technology, with sources.
One sourced briefing in the first week of each month.
Unsubscribe in one click. We don't sell your email or share it with sponsors. Privacy Policy