UAD 3.6 series Part 6 of 7
The Signal / UAD 3.6 / October 17, 2026
The grid shows its workComparable Weight, time adjustments and the comps left out under UAD 3.6
The UAD 3.6 sales comparison grid records three things the legacy 1004 never had a field for: how much the appraiser relied on each comparable, a time adjustment tied to each contract date, and the properties considered and set aside. A reviewer can now read that reasoning as data.
The Sales Comparison Approach is the longest chapter in the GSEs’ reference guide to the redesigned URAR, pages 214 to 282 of 378.1 Most of what changed for collateral review sits in its grid.
This is Part 6 of our UAD 3.6 series. Part 1 covered how the report decides its own shape; this part stays inside the grid. It walks through the GSE sample reports’ actual numbers: SF1, a single-family house with three comparables and five properties it analyzed and did not use, and a four-unit sample whose time adjustments run about 1% a month.34 Part 7 picks up where this one stops, at the reconciliation of the whole report.
From 18 printed rows to a grid that adds rows when the property needs them
Page 2 of the legacy Form 1004 prints 18 feature rows, from Sale or Financing Concessions to Porch/Patio/Deck, and 3 blank numbered lines for anything else. Every property got the same rows. The page has no row for how much each comparable counted and no place to record a property the appraiser looked at and set aside.5
The URAR grid is built from up to 12 subsections. Seven always display; the others appear when the facts call for them, such as Project Information for a condominium or Water Frontage with Private Access for a lakefront house.1
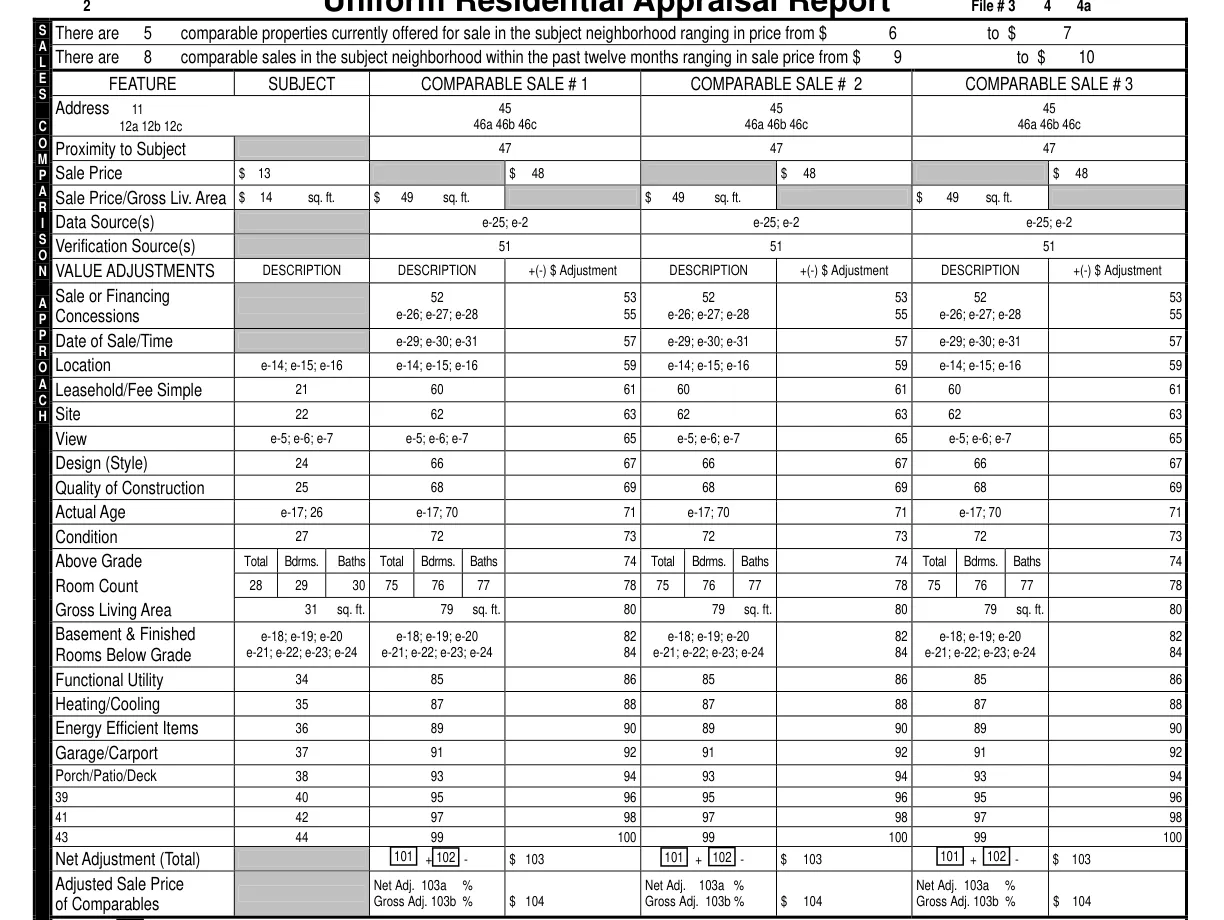
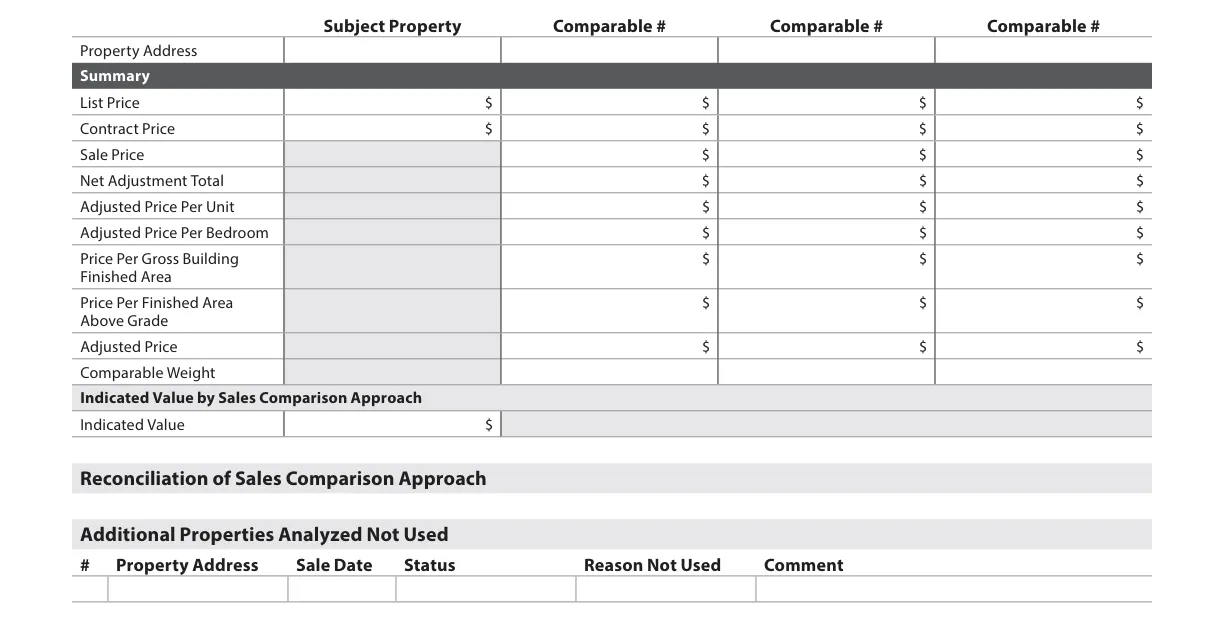
The GSEs publish every possible grid row in a companion workbook, with three flags: whether the row always displays, displays if applicable, or may display when relevant, and whether it can carry an adjustment.2 Counted across the workbook, the grid has 151 rows. Only 31 always display, and 67 can carry an adjustment.
Grid explorer
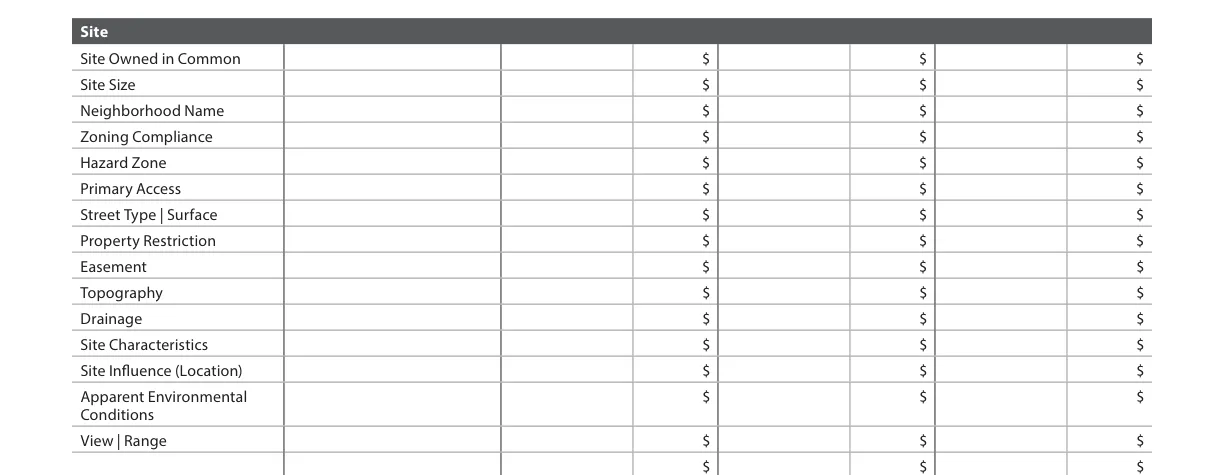
Every row the URAR sales grid can show
Pick a filter to see which rows always display, which appear when applicable or relevant, and which take an adjustment. Source: Summary of Rows in Comparable Grids v1.3, sheet “Sales Comp Grid.”2
General Informationalways · 22
- Property Address
- Data Source
- Proximity to Subject
- List Price
- Listing Status
- Contract Price
- Sale Price
- Transfer Terms
- Financing Type
- Sales Concessions
- Contract Date
- Sale Date
- Days on Market
- Sale to List Price Ratio
- Attached/Detached
- Property Rights Appraised
- Annual Ground Rent
- Native American Lands
- All Rights Included
- Rights Not Included
- Same Builder as Subject
- Additional row
Project Informationif applicable, or if relevant · 4
- Project Name | Same Project as Subject
- Monthly Fee
- Common Amenities/Services
- Special Assessments
Sitealways · 16
- Site Owned in Common
- Site Size
- Neighborhood Name
- Zoning Compliance
- Hazard Zone
- Primary Access
- Street Type | Surface
- Property Restriction
- Easement
- Topography
- Drainage
- Site Characteristics
- Site Influence (Location)
- Apparent Environmental Conditions
- View | Range
- Additional row
Water Frontage with Private Accessif applicable · 4
- Water Frontage
- Permanent Waterfront Feature
- Right to Build
- Total Linear Measurement
Dwelling(s)always · 17
- Year Built
- Structure Design
- Gross Building Finished Area
- Noncontinuous Finished Area
- Townhouse End Unit
- Townhouse Back to Back
- Townhouse Location
- Construction Method
- Manufactured Home Width
- Dwelling Style
- Total Dwelling Volume
- Window Surface Area
- Functional Issues
- Disaster Mitigation
- Heating
- Cooling
- Additional row
Energy Efficient and Green Featuresif relevant · 3
- Renewable Energy Component
- Building Certification
- Efficiency Rating
Unit(s)always · 15
- Structure ID | Unit ID
- Location of ADU
- Floor Number
- Corner Unit
- Levels in Unit
- Bedrooms
- Baths, Full | Half
- Finished Area Above Grade
- Finished Area Above Grade (Nonstandard)
- Unfinished Area Above Grade
- Finished Area Below Grade
- Finished Area Below Grade (Nonstandard)
- Unfinished Area Below Grade
- Features for Individuals w/ Disabilities
- Additional row
Quality and Conditionalways · 41
- Structure ID
- Quality
- Exterior Walls and Trim
- Foundation
- Roof
- Windows
- Other Exterior Feature
- Condition
- Exterior Walls and Trim
- Foundation
- Roof
- Windows
- Other Exterior Feature
- Structure ID | Unit ID
- Quality
- Kitchen
- Overall Bathrooms
- Overall Flooring
- Walls and Ceiling
- Other Interior Feature
- Condition
- Kitchen
- Overall Bathrooms
- Overall Flooring
- Walls and Ceiling
- Other Interior Feature
- Location of ADU
- Quality
- Kitchen
- Overall Bathrooms
- Overall Flooring
- Walls and Ceiling
- Other Interior Feature
- Condition
- Kitchen
- Overall Bathrooms
- Overall Flooring
- Walls and Ceiling
- Other Interior Feature
- Quality
- Condition
Property Amenitiesif relevant · 5
- Outdoor Accessories
- Outdoor Living
- Water Features
- Whole Home
- Miscellaneous
Vehicle Storagealways · 2
- Type | Spaces | Detail
- Additional row
Outbuildingif applicable · 12
- Outbuilding Type
- Gross Building Area
- Finished Area
- Unfinished Area
- Structure Volume
- Baths, Full
- Baths - Half
- Kitchens
- Heating
- Cooling
- Utilities
- Additional row
Summaryalways · 10
- List Price
- Contract Price
- Sale Price
- Net Adjustment Total
- Adjusted Price Per Unit
- Adjusted Price Per Bedroom
- Price Per Gross Building Finished Area
- Price Per Finished Area Above Grade
- Adjusted Price
- Comparable Weight
- Always displays
- If applicable
- May display
- Dot: adjustable
151 rows, one square each. Point at a square for its name.
Every row by name
General Information
- Property Address
- Data Source
- Proximity to Subject
- List Price
- Listing Status
- Contract Price
- Sale Price
- Transfer Terms±
- Financing Type±
- Sales Concessions±
- Contract Date±
- Sale Date±
- Days on Market
- Sale to List Price Ratio±
- Attached/Detached±
- Property Rights Appraised±
- Annual Ground Rent
- Native American Lands±
- All Rights Included±
- Rights Not Included
- Same Builder as Subject
- Additional row±
Project Information
- Project Name | Same Project as Subject
- Monthly Fee
- Common Amenities/Services
- Special Assessments
Site
- Site Owned in Common±
- Site Size±
- Neighborhood Name±
- Zoning Compliance±
- Hazard Zone±
- Primary Access±
- Street Type | Surface±
- Property Restriction±
- Easement±
- Topography±
- Drainage±
- Site Characteristics±
- Site Influence (Location)±
- Apparent Environmental Conditions±
- View | Range±
- Additional row±
Water Frontage with Private Access
- Water Frontage
- Permanent Waterfront Feature
- Right to Build
- Total Linear Measurement
Dwelling(s)
- Year Built±
- Structure Design±
- Gross Building Finished Area±
- Noncontinuous Finished Area±
- Townhouse End Unit±
- Townhouse Back to Back±
- Townhouse Location±
- Construction Method±
- Manufactured Home Width±
- Dwelling Style±
- Total Dwelling Volume±
- Window Surface Area±
- Functional Issues±
- Disaster Mitigation±
- Heating±
- Cooling±
- Additional row±
Energy Efficient and Green Features
- Renewable Energy Component
- Building Certification
- Efficiency Rating
Unit(s)
- Structure ID | Unit ID
- Location of ADU±
- Floor Number±
- Corner Unit±
- Levels in Unit±
- Bedrooms±
- Baths, Full | Half±
- Finished Area Above Grade±
- Finished Area Above Grade (Nonstandard)±
- Unfinished Area Above Grade±
- Finished Area Below Grade±
- Finished Area Below Grade (Nonstandard)±
- Unfinished Area Below Grade±
- Features for Individuals w/ Disabilities±
- Additional row±
Quality and Condition
- ExteriorStructure ID
- ExteriorQuality
- ExteriorExterior Walls and Trim
- ExteriorFoundation
- ExteriorRoof
- ExteriorWindows
- ExteriorOther Exterior Feature
- ExteriorCondition
- ExteriorExterior Walls and Trim
- ExteriorFoundation
- ExteriorRoof
- ExteriorWindows
- ExteriorOther Exterior Feature
- InteriorStructure ID | Unit ID
- InteriorQuality
- InteriorKitchen
- InteriorOverall Bathrooms
- InteriorOverall Flooring
- InteriorWalls and Ceiling
- InteriorOther Interior Feature
- InteriorCondition
- InteriorKitchen
- InteriorOverall Bathrooms
- InteriorOverall Flooring
- InteriorWalls and Ceiling
- InteriorOther Interior Feature
- ADU interiorLocation of ADU
- ADU interiorQuality
- ADU interiorKitchen
- ADU interiorOverall Bathrooms
- ADU interiorOverall Flooring
- ADU interiorWalls and Ceiling
- ADU interiorOther Interior Feature
- ADU interiorCondition
- ADU interiorKitchen
- ADU interiorOverall Bathrooms
- ADU interiorOverall Flooring
- ADU interiorWalls and Ceiling
- ADU interiorOther Interior Feature
- OverallQuality±
- OverallCondition±
Property Amenities
- Outdoor Accessories±
- Outdoor Living±
- Water Features±
- Whole Home±
- Miscellaneous±
Vehicle Storage
- Type | Spaces | Detail±
- Additional row
Outbuilding
- Outbuilding Type±
- Gross Building Area
- Finished Area
- Unfinished Area
- Structure Volume
- Baths, Full
- Baths - Half
- Kitchens
- Heating
- Cooling
- Utilities
- Additional row
Summary
- List Price
- Contract Price
- Sale Price
- Net Adjustment Total
- Adjusted Price Per Unit
- Adjusted Price Per Bedroom
- Price Per Gross Building Finished Area
- Price Per Finished Area Above Grade
- Adjusted Price
- Comparable Weight
The time adjustment now sits on the Contract Date row
The legacy grid had one row, Date of Sale/Time. The URAR splits it into Contract Date (22.01.30) and Sale Date, and the market-change adjustment goes on the Contract Date row. F-1’s note is direct: “If Contract Date is known, use this row to make time adjustments based on changes in the market.”1 A pending comparable has a contract date too, so it gets the same treatment as a closed sale.
Fannie Mae’s policy asks the appraiser to determine whether market conditions changed “from the time the comparable went under contract to the effective date of the appraisal report.” Support can come from home price indices, statistical analysis, modeling or paired sales, and the report “must, at a minimum, summarize the supporting evidence and include a description of the data sources, tool(s), and technique(s) used.” If the contract date is unavailable, the appraiser enters unknown.7
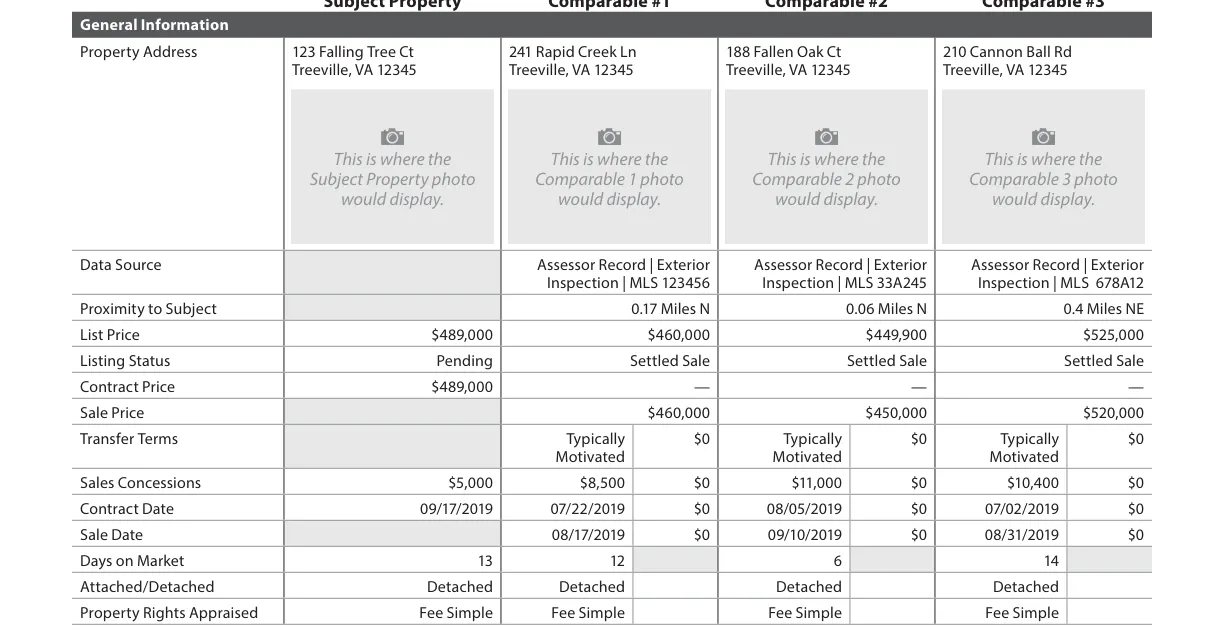
Fannie Mae also publishes a one-page illustration of the logic. Over 12 months the market rose 7%. A comparable whose contract captured 5% of that rise is adjusted up 2%; one that captured 8% is adjusted down 1%; one at 7% gets no adjustment.8 The adjustment is the market change the comparable’s price did not yet reflect.
Time-adjustment calculator
Move the market and watch each comparable’s adjustment
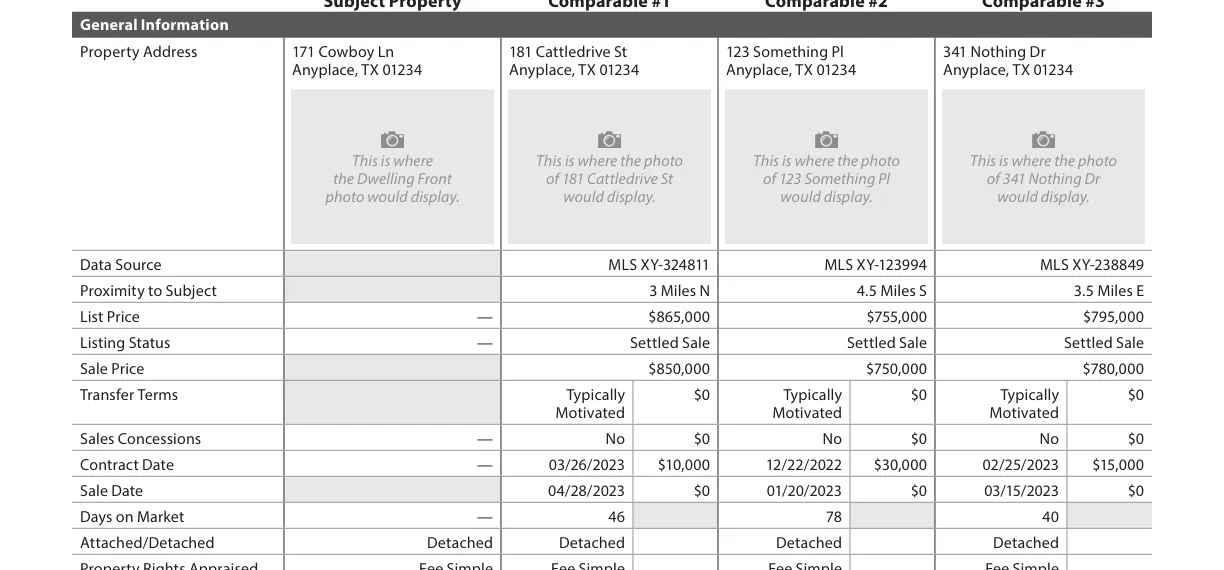
Effective date 05/01/2023. Each adjustment is price × rate × months from contract date, rounded to $1,000. At 1.0% the calculator gives $10,000, $32,000 and $17,000. The report shows $10,000, $30,000 and $15,000, about 0.9% to 1.0% a month, which its reconciliation describes as “approximately 1% per month.”
| Comp | Contract | Days | Sale price | At this rate | In the report |
|---|---|---|---|---|---|
| 1 | 03/26/2023 | 36 | $850,000 | $10,000 | $10,000 |
| 2 | 12/22/2022 | 130 | $750,000 | $32,000 | $30,000 |
| 3 | 02/25/2023 | 65 | $780,000 | $17,000 | $15,000 |
Each comparable’s change as of its contract date is fixed, as in the illustration. Adjustment = market change minus the comparable’s change.
- Comparable 15% at contractUp 2%
- Comparable 28% at contractDown 1%
- Comparable 36% at contractUp 1%
- Comparable 47% at contractNo adjustment
Sources: 2- to 4-unit Scenario 2 v1.2, PDF pp. 16 to 17;4 Fannie Mae, Market Condition Adjustments, 5.22.25.8 A teaching tool that restates published arithmetic, not a market model.
- Scenario 2
- SF1
- MH1
Sources: SF1 v1.4 p. 14; 2- to 4-unit Scenario 2 v1.2 p. 16; MH1 v1.4 p. 21.34 These are the sample set’s published examples, not a market sample.
Data table
| Sample, comparable | Days | Adjustment | Share of price |
|---|---|---|---|
| SF1 1 | 60 | $0 | 0.0% |
| SF1 2 | 46 | $0 | 0.0% |
| SF1 3 | 80 | $0 | 0.0% |
| Scenario 2 1 | 36 | $10,000 | 1.2% |
| Scenario 2 2 | 130 | $30,000 | 4.0% |
| Scenario 2 3 | 65 | $15,000 | 1.9% |
| MH1 1 | 116 | $0 | 0.0% |
| MH1 2 | 112 | $0 | 0.0% |
| MH1 3 | 544 | $5,000 | 1.4% |
MH1 carries $0 on two comparables with contracts 112 and 116 days old; that can be right in a flat market, and the policy treats a zero adjustment as a conclusion that needs the same market support as any other. MH1’s third comparable, a short sale with a contract 544 days old, carries $5,000, about 1.4%.37
Location becomes Site Influence, and View gets a list for every comparable
The legacy Location row held a short coded entry. The URAR replaces it with Site Influence (Location), a multi-select list that always displays and can be adjusted for every comparable. View | Range always displays too, with a view type and a range of Full, Partial, Seasonal or Other.1 The subject’s impact rating for view and influence lives in the Site section, which the series covers in Part 2.
Site Influence 20 named values, plus Other
- Agricultural
- Airport
- Body of Water
- Busy Roadway
- Commercial Area
- Golf Course
- Green Space
- High Density Residential
- High Pressure Gas Line
- Historic District
- Industrial Area
- Local Distribution Line
- Oil or Gas Well
- Overhead Electric Power Transmission Line
- Park
- Public Transportation Hub
- Rail Line
- Residential
- School
- Stormwater Retention
View 28 named values, plus Other
- Bay
- Canal
- City Street
- Commercial
- Cove
- Creek
- Golf Course
- Gulf
- High Density Residential
- Highway
- Industrial
- Lake
- Marsh
- Mountain
- Ocean
- Park
- Parking Lot
- Pastoral
- Pond
- Reservoir
- Residential
- River
- School
- Skyline
- Sound
- Traffic Wall Barriers
- Valley
- Woods
Apparent Environmental Conditions 9 named values, plus None and Other
- Hazardous Above Ground Storage Tank
- Hazardous Substances
- Landfill
- Radon
- Slush Pit
- Soil Contamination
- Superfund Site
- Underground Storage Tank
- Water Contamination
Source: UAD 3.6 schema, enumerated types v1.3 (SiteInfluenceBase, ViewBase, EnvironmentalConditionBase).9
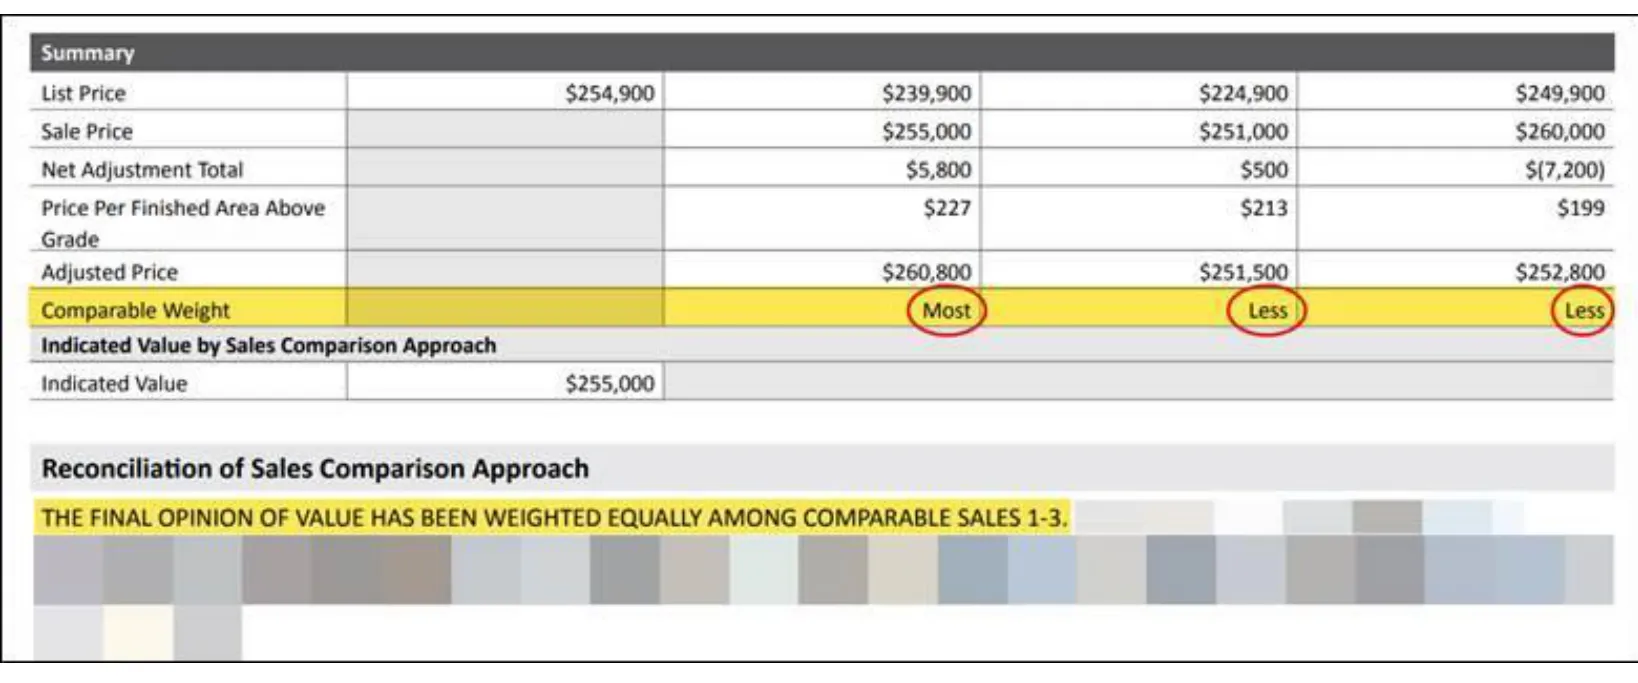
Comparable Weight puts the appraiser’s reliance on each sale in a field
Comparable Weight (22.15.14) always displays and is required for every comparable. It has three answers. Most: the comparable was given more or most emphasis. Less: less emphasis than those weighted Most. No Weight: included but given no weight, for example a model match that was not a typical market transaction.1 Fannie Mae’s policy uses the same three words: the appraiser’s comments must “identify why the sale(s) were given the most weight, less weight, or no weight.”7
F-1 adds a guardrail. A property considered only to show a special feature, and never put in the grid, does not get No Weight. It goes in Additional Properties Analyzed Not Used, the subject of chapter 05.1
Field lift: SF1’s weights
Three comparables, three weights
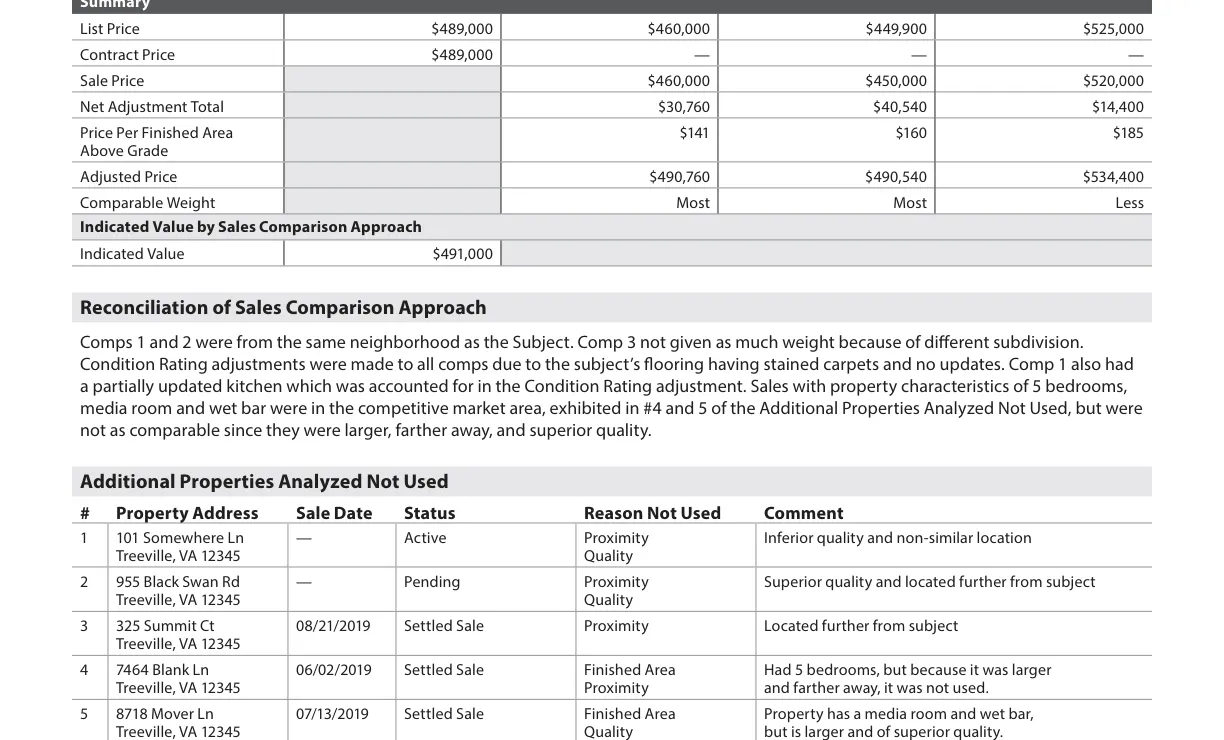
| Comp | Adjusted price | 22.15.14 |
|---|---|---|
| 1 | $490,760 | Most |
| 2 | $490,540 | Most |
| 3 | $534,400 | Less |
“Comps 1 and 2 were from the same neighborhood as the Subject. Comp 3 not given as much weight because of different subdivision.”
Reconciliation of Sales Comparison Approach (22.16.01)
SF1 is a consistent file: two Most, one Less, and a sentence that says why. The GSEs’ Lessons Learned job aid shows the failure the field exposes. Its example grid reports Most, Less and Less, and the reconciliation reads, in canned UAD 2.6 language, that the value “HAS BEEN WEIGHTED EQUALLY AMONG COMPARABLE SALES 1-3.”10
The properties the appraiser looked at and set aside now have a table
Additional Properties Analyzed Not Used has no legacy counterpart. Each row records an address, a sale date where there is one, a status, a Reason Not Used from an 18-answer list, and a required Comment. Land sales are excluded. The table displays when relevant, “initially, for the appraiser to provide additional context, or as part of any reconsideration process.”1
 AI-generated illustration
SF1: five properties analyzed, not used
- 1101 Somewhere LnActive
Inferior quality and non-similar location
- Proximity
- Quality
- 2955 Black Swan RdPending
Superior quality and located further from subject
- Proximity
- Quality
- 3325 Summit CtSettled Sale, 08/21/2019
Located further from subject
- Proximity
- 47464 Blank LnSettled Sale, 06/02/2019
Had 5 bedrooms, but because it was larger and farther away, it was not used.
- Finished Area
- Proximity
- 58718 Mover LnSettled Sale, 07/13/2019
Property has a media room and wet bar, but is larger and of superior quality.
- Finished Area
- Quality
Rows from GSE sample SF1, v1.4, PDF p. 15;3 the 18 Reason Not Used answers from Appendix F-1 v1.4, p. 281.1
SF1’s reconciliation ties the table back to the grid: sales with five bedrooms, a media room and a wet bar were in the competitive market area, “exhibited in #4 and 5 of the Additional Properties Analyzed Not Used, but were not as comparable since they were larger, farther away, and superior quality.”3 A reviewer who wonders why those sales are missing can read the answer in the file.
The table matters for reconsideration of value as well. When a borrower or lender submits alternative sales, F-1 lets them appear here with the appraiser’s reason. Our reconsideration of value feature covers that process.
A four-unit grid reports price per unit, and the value must sit inside the adjusted range
The grid has no row that adjusts for a difference in unit count. Gross Building Finished Area, the combined area of all units, displays when the subject has more than one unit, and the Summary calculates Adjusted Price Per Unit (22.15.09): the comparable’s adjusted price divided by its units excluding ADUs.1 For small multifamily collateral that is a per-unit figure on every comparable, without recomputing it from area and bedroom counts.
- Comparable 1 Less$198,850
- Comparable 2 Less$193,100
- Comparable 3 Most$196,100
Source: 2- to 4-unit Scenario 2 v1.2, PDF p. 17.4
Fannie Mae’s policy adds a check that the grid makes easy: “the indicated value in the Sales Comparison Approach must be within the range of the adjusted sales price of the comparables.”7 Both samples pass, and the figure shows by how much.
Scenario 2 shows the pieces working together. Comparable 1 sold for the most, $850,000, and still ends lowest-but-one after a net adjustment of −$54,600. The appraiser placed Most weight on Comparable 3, “which best reflects the subject property,” and its per-unit figure sits between the other two. The indicated value, $785,000, is within $600 of Comparable 3’s adjusted price.4
What a collateral team can test in this grid, and where the data stops
Each check below reads fields the grid now carries. None of them needs a reviewer to reconstruct the appraiser’s reasoning from an addendum first.
FOR EACH comparable:
  IF Comparable Weight (22.15.14) = "Most"
     AND Reconciliation of SCA (22.16.01) does not name it
  THEN flag "weight not explained"

  IF Listing Status IN ("Pending", "Settled Sale")
     AND days from Contract Date (22.01.30) to effective date > 90
     AND Contract Date adjustment = 0
     AND 22.16.01 names no technique (HPI, paired sales, model)
  THEN flag "zero time adjustment without support"

  IF Comparable Weight = "No Weight"
     AND the same address appears in Additional Properties
         Analyzed Not Used (22.17.02)
  THEN flag "listed twice"

FOR EACH additional property analyzed not used:
  IF Reason Not Used (22.17.05) = "Other (Describe)"
     AND Comment (22.17.06) is shorter than your minimum
  THEN flag "reason not explained"

IF Indicated Value (22.15.15) is outside the range of
   Adjusted Price (22.15.13) across the comparables
THEN flag "outside adjusted range" (SB4-1.3-09)Where the data stops
- Weight is self-reported. Comparable Weight comes from the same appraiser whose adjustments it describes. It exposes a contradiction between the weights and the commentary; it cannot show that the weighting was sound.
- Reason codes can be thin. Other (Describe) and a technically accurate but uninformative reason both pass. The Comment field is where the explanation lives, and it is free text.
- Contract dates come from the appraiser’s sources. F-1 allows Contract Date Unknown, and nothing in the report checks a date against an independent record.
- Exact-looking numbers inherit their inputs. Adjusted Price Per Unit and a time adjustment are calculations on reported prices and dates, and carry any error in them.
- Automated suggestions still need documentation. If a model proposes a time adjustment, SB4-1.3-09 still requires the report to describe the data sources, tools and technique. Collateral teams should keep any model output they use for review separate from requests to the appraiser about value.7
Six checks for the next sales grid you review
Sales grid review
0 of 6 checked
Saved in this browser only.
One gap remains open. The grid records the appraiser’s contract dates, weights and reasons in a form a machine can read, and nothing in UAD 3.6 checks those entries against an independent transaction record. A lender that wants that check has to build it, for example by matching contract and sale dates to MLS or public-record data it already licenses.
Research checked Oct. 17, 2026 against the GSE documents listed below. Row counts were made by ValuSignal from the Summary of Rows workbook; day counts and percentages are calculated from the sample reports’ dates and prices. The street, houses and fourplex are fictional and were generated with Higgsfield; the form pages and sample grids are screenshots of GSE publications. General information, not legal, lending or appraisal advice.
Sources
10 documents, accessed Oct. 16 to 17, 2026
- Fannie Mae and Freddie Mac, Appendix F-1: URAR Reference Guide, v1.4, chapter 22March 10, 2026
- Fannie Mae and Freddie Mac, Appendix F-1 Supplement: Summary of Rows in Comparable Grids, v1.3, sheet "Sales Comp Grid"In the F-1 package
- Fannie Mae and Freddie Mac, Appendix D-1: URAR Sample Scenarios and XML Files, SF1 and MH1 sample reports, v1.4March 10, 2026
- Fannie Mae and Freddie Mac, Appendix D-1: 2- to 4-unit Scenario 2 sample report, v1.2In the D-1 package
- Fannie Mae and Freddie Mac, UAD Specification Appendix C: Form 1004/70 with numbered fieldsForm dated March 2005
- Fannie Mae and Freddie Mac, Appendix C-1: URAR layout, v1.3Current package
- Fannie Mae, Selling Guide Supplement: UAD 3.6 Policy, SB4-1.3-08 and SB4-1.3-09Sept. 2, 2026
- Fannie Mae, Market Condition Adjustments (illustration linked from Selling Guide B4-1.3-09)May 22, 2025
- Fannie Mae and Freddie Mac, UAD 3.6 schema, enumerated types v1.3Current package
- Fannie Mae and Freddie Mac, UAD 3.6 Job Aid: Guidance for Appraisers through Lessons Learned, v1.0June 23, 2026
The Signal / Monthly briefing
Follow the UAD 3.6 series as each part publishes.
One sourced briefing in the first week of each month on valuation policy, collateral risk and property technology.
Unsubscribe in one click. We don't sell your email or share it with sponsors. Privacy Policy