UAD 3.6 series Part 7 of 7
The Signal / UAD 3.6 / October 17, 2026
Where the value landsMarket data, approaches to value and the two range rules under UAD 3.6
The last two sections of the redesigned URAR replace a checkbox neighborhood summary and three blank value lines with search counts, a value or a stated reason for every approach, and a value condition tied to the defects table. Two Fannie Mae range rules now apply to numbers a reviewer can read straight from the file.
The Market and Reconciliation sections are where a URAR states its conclusion: what competing properties did over the lookback period, what each approach to value indicates, and the one number the appraiser reports.
This is Part 7, the last of our UAD 3.6 series. Part 1 covered how the report decides its own shape, and Part 6 covered the sales grid, including Comparable Weight. This part picks up where the grid hands off. It uses the GSE sample reports throughout: SF3, a rural property with an accessory dwelling unit, as the worked example, and the twelve sample appraisals the GSEs have published for UAD 3.6 to test Fannie Mae’s two range rules.23
The Neighborhood section becomes a Market section built from search results
The legacy Form 1004 summarized the neighborhood in checkboxes: urban, suburban or rural; how built up; how fast it was growing; whether property values were increasing, stable or declining. A price range and a predominant price sat beside them, with two free-text boxes underneath.6 Fannie Mae stopped requiring its separate Market Conditions Addendum, Form 1004MC, in August 2018, saying Collateral Underwriter “now provides robust market trend information” and that appraisers “remain responsible for analyzing market conditions and accurately reporting them in the Neighborhood section.”8
The URAR’s Market section replaces all of it. It has 20 field IDs, 17.003 to 17.023: 10 always required, 8 required when another answer calls for them, and 2 included if applicable. Most of them are counts and prices from the appraiser’s own search of competing properties.1
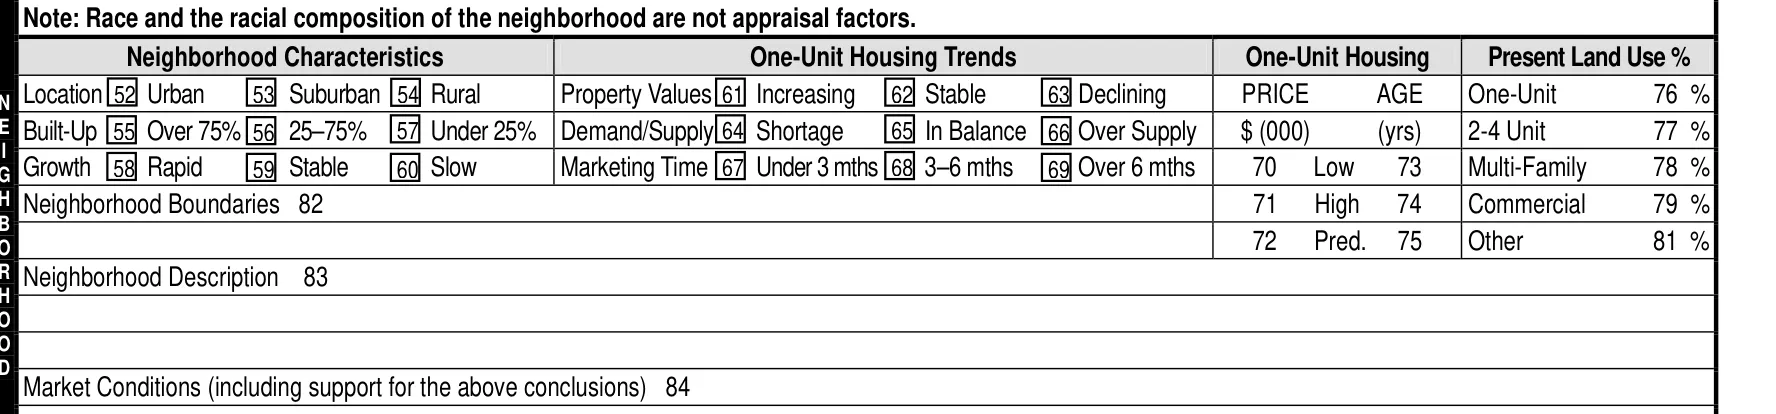
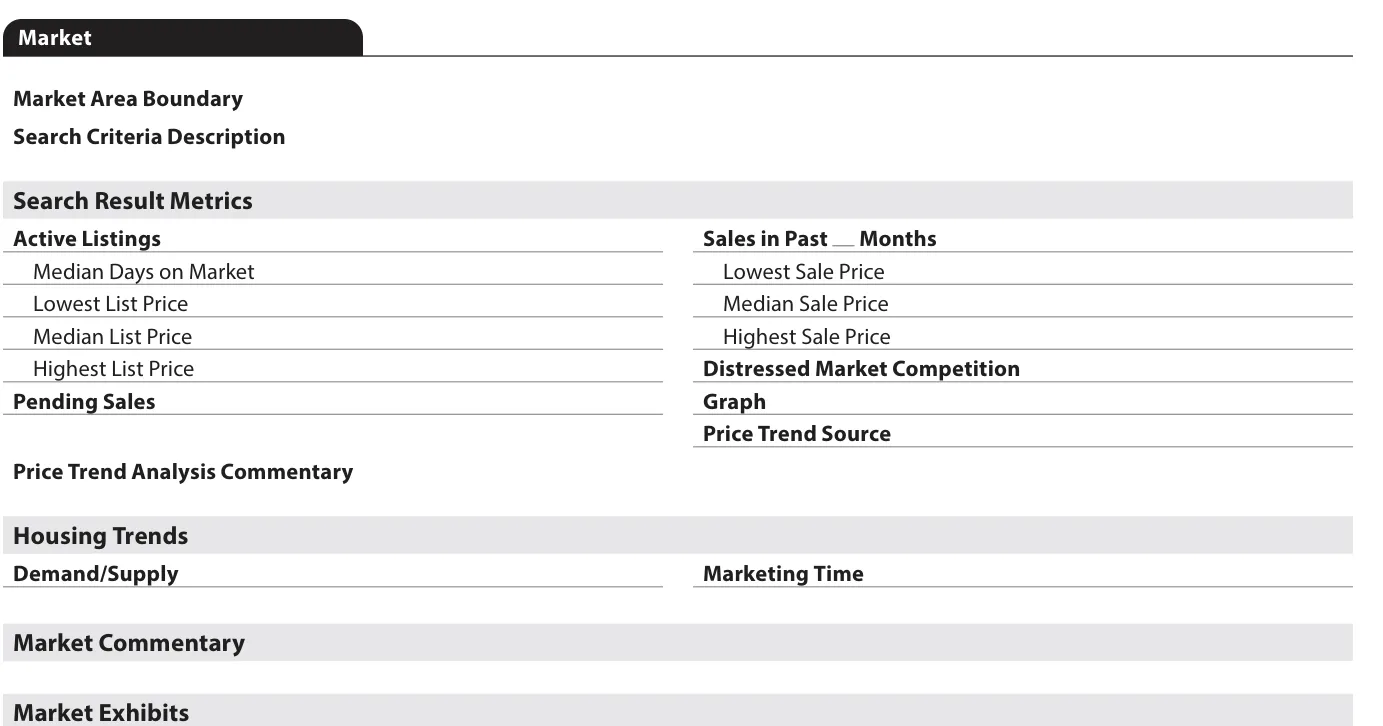
The GSEs’ cross-reference workbook maps every legacy field to its URAR successor. Of the Neighborhood section’s 11 groups, 5 have one.5
- 52 to 54Location: Urban, Suburban, Rural
NoneNo UAD 3.6 field - 55 to 57Built-Up: Over 75%, 25 to 75%, Under 25%
NoneNo UAD 3.6 field - 58 to 60Growth: Rapid, Stable, Slow
NoneNo UAD 3.6 field - 61 to 63Property Values: Increasing, Stable, Declining
NoneNo UAD 3.6 field. Its draft successor, 17.020 Property Value Trend, was deleted in F-1 v1.2 - 64 to 66Demand/Supply: Shortage, In Balance, Over Supply
17.021Same three answers - 67 to 69Marketing Time: Under 3, 3 to 6, Over 6 months
17.022Same three answers - 70 to 72One-Unit Housing Price: Low, High, Predominant
17.01317.01517.014Predominant becomes Median Sale Price - 73 to 75One-Unit Housing Age: Low, High, Predominant
NoneNo UAD 3.6 field - 76 to 81Present Land Use %
NoneNo UAD 3.6 field - 82Neighborhood Boundaries
17.003Market Area Boundary - 83 to 84Neighborhood Description and Market Conditions
2.0613.0324.11617.023Split across four commentary fields
Source: Appendix G-1, Redesign to Legacy Cross Reference v1.4, sheet “Cross Ref Guide (Clean) 1.4.”5
Demand/Supply and Marketing Time carried over with the same three answers each. The price range became low, median and high sale prices, and the market area boundary kept its own field. Location, Built-Up, Growth, the age range and present land use have no successor field.
Price direction has none either. A draft of the URAR had a field for it, 17.020 Property Value Trend. Version 1.2 of the reference guide, published September 17, 2024, deleted it (change 2024-024), which is why the numbering skips from 17.019 to 17.021.1 The trend now lives in Price Trend Analysis Commentary (17.019), in Market Commentary, or in an attached graph image.
SF3’s Market section, and the arithmetic its fields allow
SF3 is a house with an accessory dwelling unit on 10 to 20 acres in rural Virginia, within commuting distance of Washington. Its market area runs from Route 7 to the north, Route 611 to the east and Route 50 to the south and west. The search was limited to similar acreage with an ADU, 1,800 to 4,500 square feet, 3 to 5 bedrooms and at least a two-car garage, closing between 08/18/2018 and 08/30/2019.2
It returned 15 active listings with a median of 125 days on market, 3 pending sales, and 34 sales in the past 12 months from $599,900 to $949,999. Distressed Market Competition is No; Demand/Supply is In Balance; Marketing Time is 3 to 6 months.2
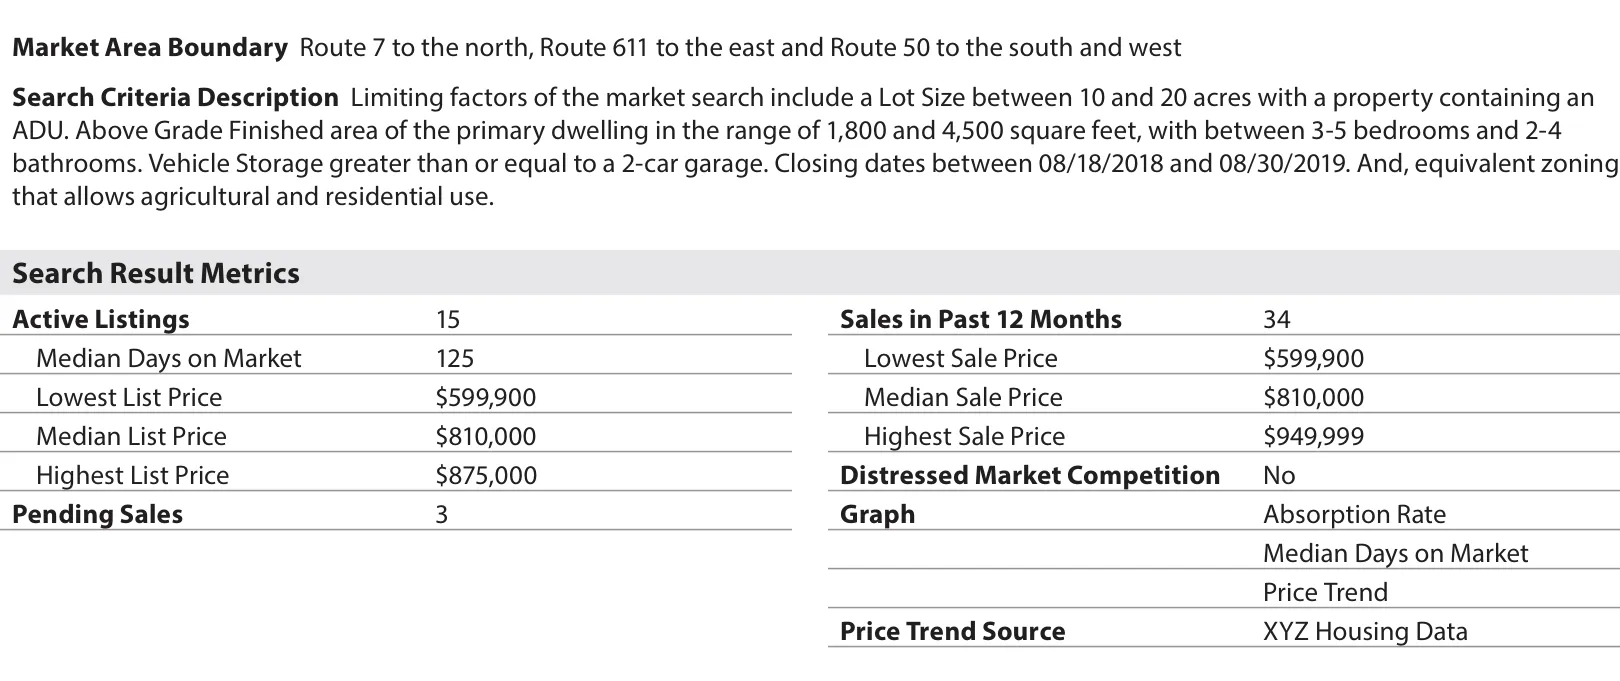
Those numbers support a check the legacy checkboxes did not. F-1 defines the absorption rate as settled or pending sales divided by the months in the lookback period, and months of supply as listings divided by that rate.1 SF3’s fields give 2.8 settled sales a month and 5.3 months of supply. Counting the 3 pending sales as well gives 4.9 months. The appraiser’s commentary says 3 to 4 sales a month and a 4 to 5 month supply, which matches the second method.2

SF3 also selected three graphs: Absorption Rate, Median Days on Market and Price Trend. In the sample package each graph is a gray placeholder that reads “This is where the Price Trend graph would display,” and the MISMO file carries it as an image attachment (ImageCategoryType PriceTrendGraph) with no chart data.2
Market explorer
Six GSE samples: what the fields compute against what the appraiser reported
Pick a sample. The computed figures use F-1’s absorption arithmetic on that report’s Search Result Metrics. They are our calculation from each report’s fields.
Rural acreage with an ADU · 12-month lookback · v1.4, PDF p. 16
- Demand/Supply (17.021)
- In Balance
- Marketing Time (17.022)
- 3 to 6 months
- Distressed competition (17.016)
- No
34 sales and 15 listings: about 5 months of supply, reported In Balance with 3 to 6 months to sell. The commentary’s own figure, 4 to 5 months, counts pending sales too.
Sources: each sample’s Market section, Appendix D-1 v1.4;2 absorption arithmetic, Appendix F-1 v1.4, p. 181.1 The samples were built to demonstrate the form, so their markets are illustrations.
F-1 gives Demand/Supply and Marketing Time three answers each and no numeric cut-offs; Marketing Time is “the range of time needed to sell competitive properties.”1 A large gap between the computed supply and the reported answers is a reason to ask how the search was drawn. SF2 is the clearest case in the set: 6 sales in 12 months against 8 listings is 16 months of supply on settled sales, reported as In Balance with marketing under 3 months.
Every approach to value gets an indicated value or a reason it was left out
Page 2 of the legacy 1004 has one line for three indicated values: sales comparison, then cost and income, each “if developed.” A skipped approach was a blank.6 The URAR’s Approaches to Value table has a column for each approach with two rows, Indicated Value and Reason for Exclusion (26.000 to 26.005).1
The reasons are closed lists. Income: Insufficient Data, Not Necessary for Credible Results, or Other. Cost: Difficulty Estimating Depreciation, Lack of Land Sales, Not Necessary for Credible Results, or Other. The Sales Comparison Approach can be excluded only with Other and a description.1
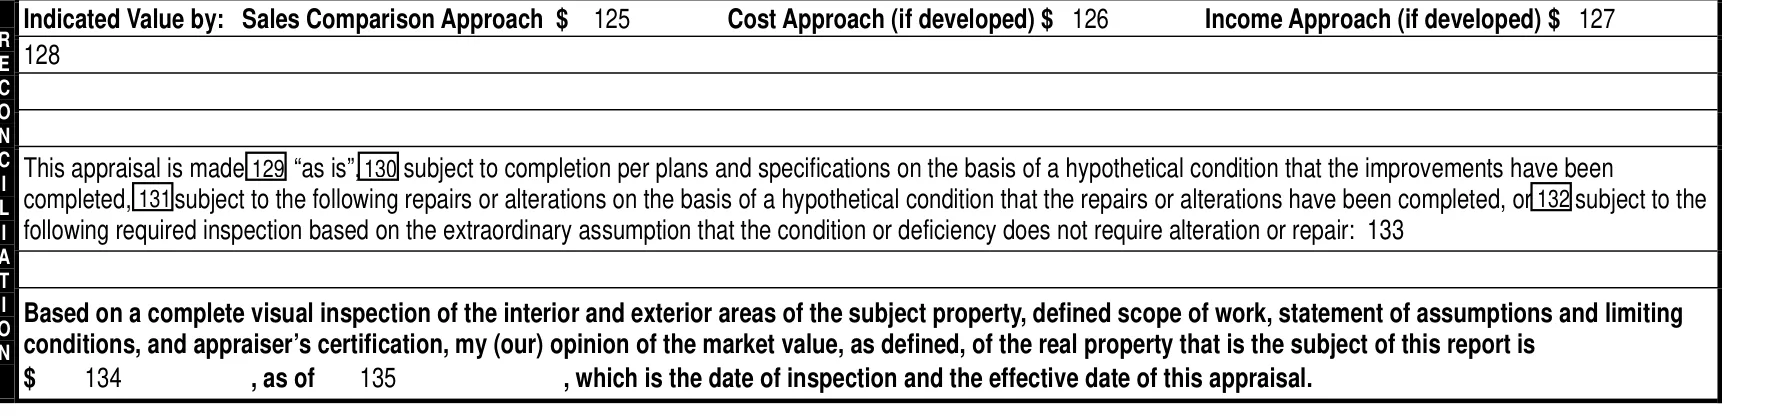
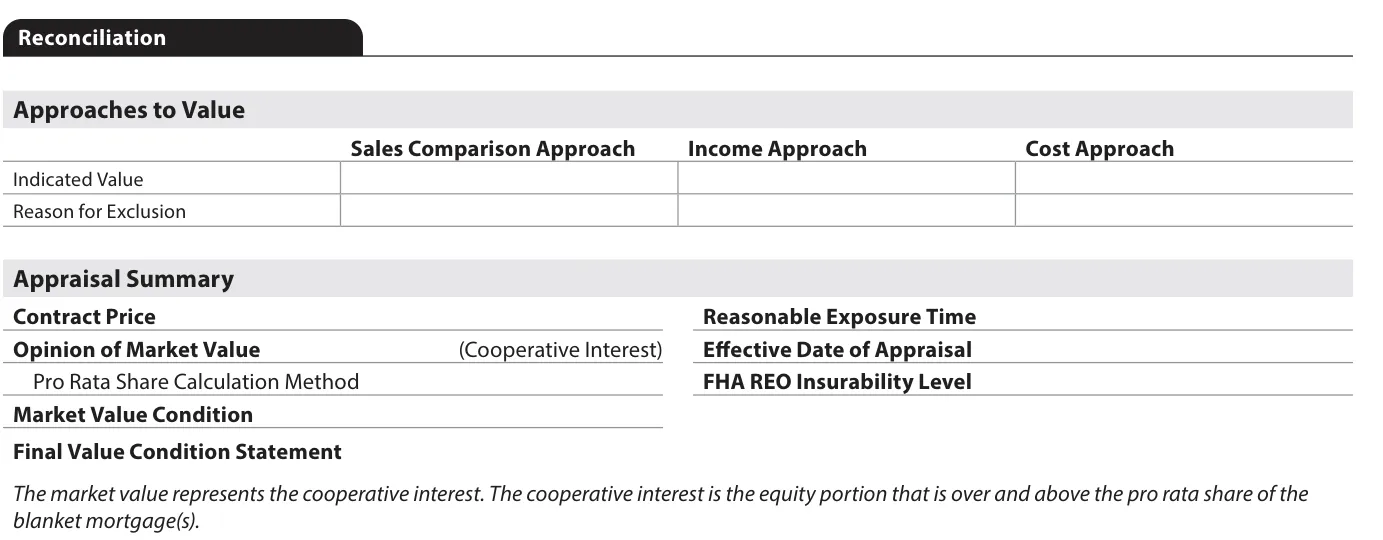
Fannie Mae’s policy sets the expectations. It does not require the cost approach “except for the valuation of manufactured homes,” and the income approach “is required in the valuation of two to four-unit properties.” Either may also be needed where USPAP requires it for credible results.4 The twelve sample appraisals follow that pattern.
| Sample | Sales comparison | Income | Cost |
|---|---|---|---|
| SF3Rural acreage with an ADU | $775K | Not necessary | Not necessary |
| SF1Suburban single-family | $491K | Not necessary | Not necessary |
| SF2Attached single-family | $880K | Insufficient data | Other |
| SF4Single-family | $775K | Not necessary | Not necessary |
| SF5Single-family | $350K | Not necessary | Not necessary |
| Condo1Condominium unit | $778K | Not necessary | Not necessary |
| Condo2Condominium, desktop | $900K | Not necessary | Not necessary |
| Coop1Cooperative unit | $595K | Not necessary | Not necessary |
| MH1Manufactured home | $445K | Not necessary | $459K |
| MH2Manufactured home | $275K | Not necessary | $271K |
| 2- to 4-unitSmall multifamily | $195K | $198K | Depreciation |
| Scenario 2Four-unit | $785K | $780K | Not necessary |
Sources: Reconciliation sections of the D-1 sample appraisals, v1.4 and v1.2.23 Completion reports CR1 and CR2 are left out; they have no reconciliation.
Both manufactured homes develop the cost approach, and both 2- to 4-unit samples develop income. Of the 20 exclusions, 17 use Not Necessary for Credible Results. SF2, an attached house, uses Other for cost and explains it in the cell: “Not applicable for attached properties as prospective purchasers do not consider individual construction as a method when purchasing this type of property.”2
Two range rules, and SF3’s numbers through both
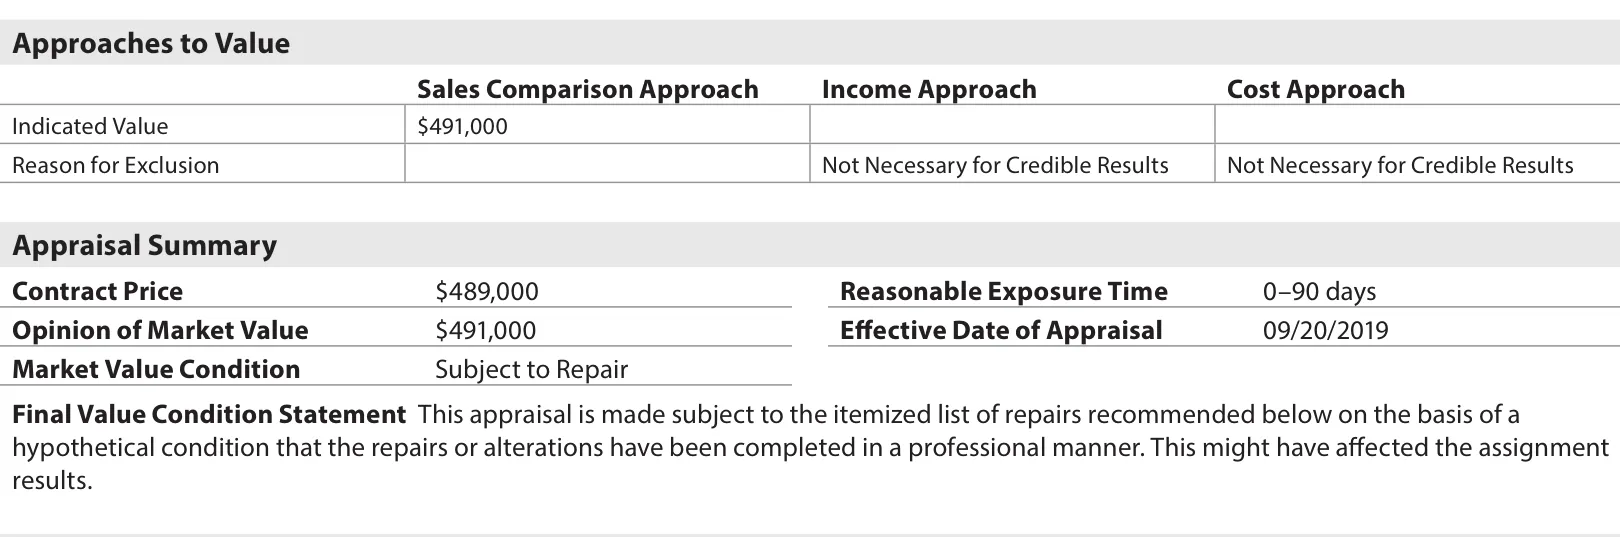
Fannie Mae’s policy states two separate checks. The first sits in the adjustments topic: “the indicated value in the Sales Comparison Approach must be within the range of the adjusted sales price of the comparables identified in the appraisal report.” The second sits in the reconciliation topic: “The final reconciled indicated value must be within the range of the values indicated by the approaches of value used in the appraisal report.”4
The same topic says the reconciliation “must not rely on simple averaging,” and that a weighted average “must include an explanation describing why it was used.”4 How much each comparable counted is recorded in Comparable Weight on the grid, which Part 6 covers; the narrative that explains it is 22.16.01.
Field lift: SF3’s reconciliation
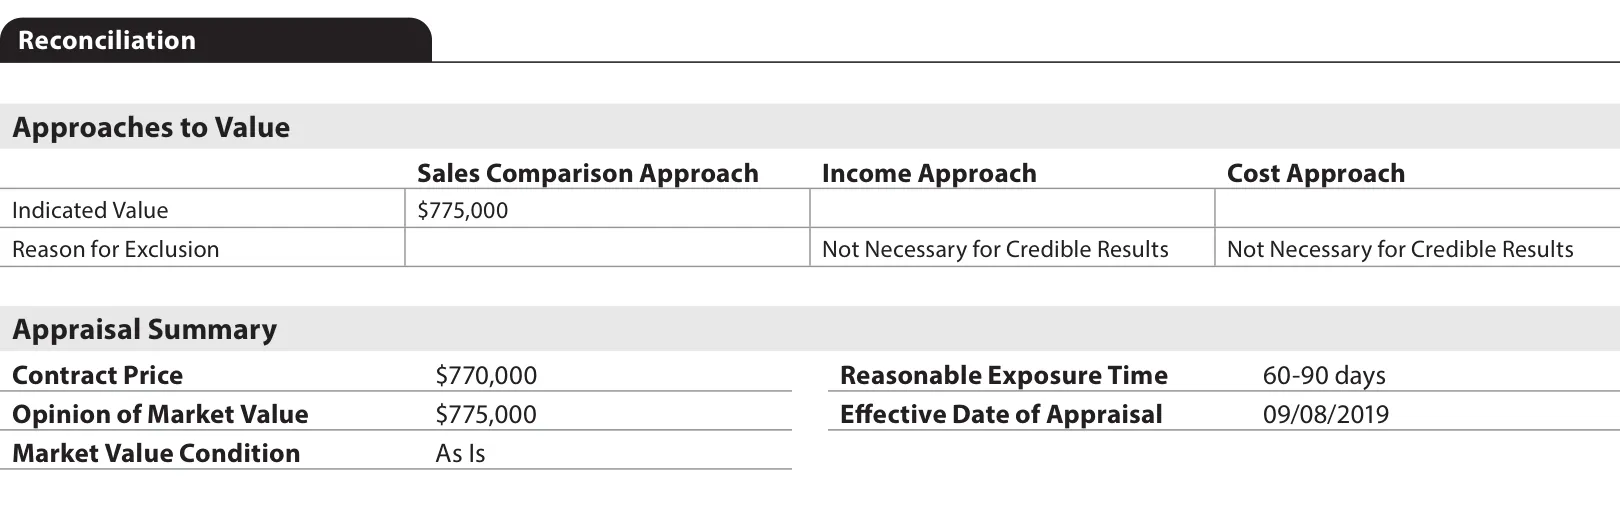
The printed reconciliation
The same page as fields
26.000Sales Comparison, indicated value$775,00026.003Income, reason for exclusionNot Necessary for Credible Results26.005Cost, reason for exclusionNot Necessary for Credible Results26.007Opinion of Market Value$775,00026.009Market Value ConditionAs Is
- Rule 1$775,000 is inside the adjusted range, $768,380 to $789,480.
- Rule 2One approach developed, so the range is $775,000 to $775,000, and the opinion equals it.
SF3 passes both. Its three comparables adjusted to $783,100, $768,380 and $789,480, weighted Most, Most and Less. A simple average would be $780,320; the appraiser concluded $775,000, between the two Most comparables.2 With only one approach developed, rule 2 leaves no room: the final value has to equal the sales comparison value.
We ran both rules on all twelve sample appraisals.
SF3: move the opinion of value
Rule 1 passesRule 2 passes
Only one approach was developed, so the opinion must equal $775,000.
Sources: grid Summary and Reconciliation of each D-1 sample appraisal, v1.4 and v1.2;23 rules from SB4-1.3-09, p. 112, and SB4-1.3-11, p. 115.4
All 12 pass rule 1. 11 of 12 pass rule 2 as written. The exception is Coop1, a cooperative: its sales comparison value is $595,000, and its opinion of market value is $548,999, labeled “Cooperative Interest.” The report explains that the value “represents the cooperative interest,” the equity above the unit’s pro rata share of the building’s blanket mortgage, and Pro Rata Share Calculation Method (26.008) is filled in.2 An automated version of rule 2 needs that exception or it will flag every co-op.
In none of the twelve does the sales comparison value equal the simple average of the adjusted prices, which is consistent with the policy against averaging.
Market Value Condition is tied to the defects table by rule
The legacy form had four checkboxes for “as is,” subject to completion, subject to repairs and subject to inspection, each followed by boilerplate the appraiser completed in free text.6 Market Value Condition (26.009) has the same four answers, and more than one can be chosen except As Is. When the answer is not As Is, the report generates a Final Value Condition Statement (26.013).1
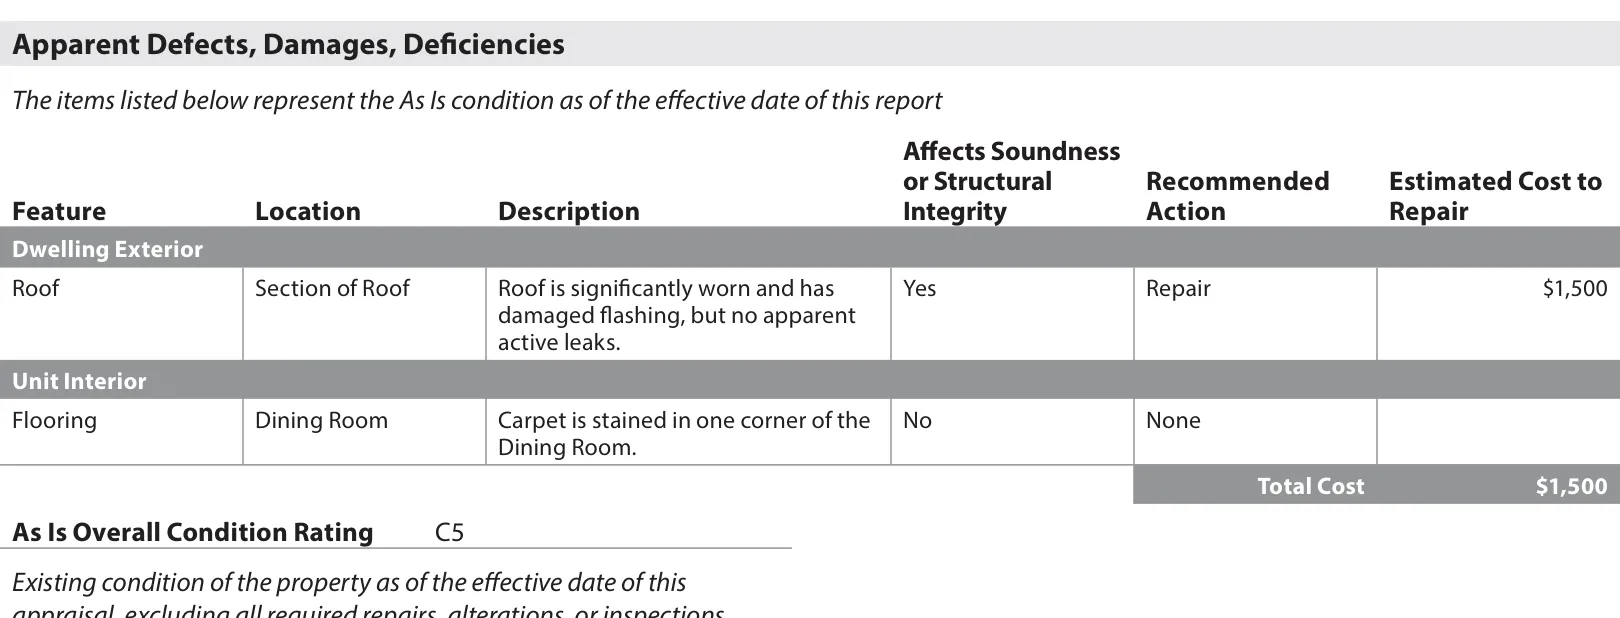
F-1 ties the answer to Apparent Defects, Damages, Deficiencies, the table the Reconciliation section redisplays from the property sections (26.020 to 26.072). A defect with a Recommended Action of Completion, Inspection or Repair means the report “must be made subject to the resolution of the item (Market Value Condition cannot be As Is).” Subject to Repair needs at least one Repair item, and Subject to Inspection at least one Inspection item.1
Condition checker
Change the condition or a defect’s action and read the F-1 result
Roof, Section of RoofRoof is significantly worn and has damaged flashing, but no apparent active leaks.Affects soundness: Yes
Flooring, Dining RoomCarpet is stained in one corner of the Dining Room.Affects soundness: No
Consistent with F-1. Subject to Repair has a Repair item, and no open item sits under As Is.
SF2 shows the multiple-answer case: Subject to Inspection and Subject to Repair together, with a generated statement covering both.2 Because the defects table carries an Estimated Cost to Repair and a total (26.070, or a lump sum in 26.072), the reconciliation also gives a lender repair amounts it can add up across a pipeline.1
What a collateral team can check in these two sections, and where the fields stop
Each row below reads fields that every UAD 3.6 report carries. None needs a vendor market-conditions feed or text extraction from a PDF.
| Capability | Reads | Replaces | Where it stops |
|---|---|---|---|
| Absorption and price-band screen across a book | 17.00517.01017.01117.01217.01317.01417.015 | Neighborhood checkboxes; Form 1004MC, which Fannie Mae stopped requiring in 2018 | Search Criteria Description (17.004) is free text, so two appraisers can define the competing market differently. |
| Sales comparison range check | 22.15.1322.15.15 | Reading the grid and the reconciliation side by side | Passing says the number is inside the range. It says nothing about whether the adjustments were right. |
| Final value range check | 26.00026.00226.00426.007 | Three dollar lines with no stated rule | Cooperative interests report a value below the approaches by design (26.008). |
| Exclusion reason monitor | 26.00126.00326.005 | A blank line on the legacy form | The list is closed, so the reason can be picked to fit the conclusion. |
| Value condition and defect consistency | 26.00926.020 to 26.069 | Four checkboxes and free text | Only catches defects the appraiser recorded. |
| Repair cost totals across a pipeline | 26.07026.072 | Repair notes scattered through the narrative | Estimates are the appraiser’s; Cost to Repair can be reported as None. |
# Field IDs: Appendix F-1 v1.4. Thresholds and routing are the lender's choice.

# 1. Sales comparison range (SB4-1.3-09)
lo, hi = min(comp[22.15.13]), max(comp[22.15.13])
IF report[22.15.15] < lo OR report[22.15.15] > hi:
    FLAG "indicated value outside adjusted range"

# 2. Final value range (SB4-1.3-11)
used = [v FOR v IN (26.000, 26.002, 26.004) IF v IS NOT NULL]
IF report[26.008] IS NULL                     # not a co-op interest
   AND (report[26.007] < min(used) OR report[26.007] > max(used)):
    FLAG "opinion of value outside approaches used"

# 3. Value condition against the defects table (F-1 p. 328)
actions = {row.recommendedAction FOR row IN report[26.020 to 26.069]}
IF "As Is" IN report[26.009] AND actions & {Completion, Inspection, Repair}:
    FLAG "As Is with an open defect"
IF "Subject to Repair" IN report[26.009] AND "Repair" NOT IN actions:
    FLAG "Subject to Repair with no Repair item"

# 4. Exclusion reasons, per appraiser or panel, monthly
share = count(26.003 or 26.005 == "Not Necessary for Credible Results") / count(excluded)
IF share > LENDER_THRESHOLD: REVIEW sample of files

# 5. 2- to 4-unit files: Income Approach expected (SB4-1.3-10)
IF units >= 2 AND report[26.002] IS NULL: REVIEW reason in 26.003Where the data stops
- The search defines the market. Search Criteria Description is free text, so two appraisers in the same area can return different counts. Comparing Search Result Metrics across reports means reading the criteria too. Our Plano leading-indicators feature covers aggregating UAD data across a portfolio.
- Clean numbers inherit their source. The metrics come from the appraiser’s MLS or public-record search and carry its duplicates, relistings and gaps. Sales that never reached an MLS do not appear; our private listings feature covers that gap.
- Closed lists can be chosen to fit. A Reason for Exclusion, like a Comparable Weight, is picked by the appraiser. The field makes a pattern countable; it does not show that the choice was right.
- Passing a range rule is a floor. A value inside the adjusted range can still rest on poor comparables or unsupported adjustments.
- Price direction is no longer a field. With 17.020 deleted, trend has to be computed or read from commentary, which brings back the text-parsing problem the rest of the redesign removes.
- These checks run after delivery. Every check here belongs after the report is delivered, in a reviewer’s queue. Sending a computed value back to the appraiser as a target would raise appraiser independence problems. When a borrower asks for a reconsideration of value, the outcome is recorded in Revision History (27.000 to 27.006); our reconsideration of value feature covers that process.
Seven checks for one file, one from each part of the series
Each check below reads fields the redesigned URAR now carries, and each comes from one part of this series. Run them top to bottom on a single UAD 3.6 file. Your progress is saved in this browser.
One-file review
0 of 7 checked
Saved in this browser only.
Checks 1 and 6 come from Part 1 and Part 6; checks 2 to 5 come from the parts on the Site section, measurement, condition and disaster mitigation as they publish. Check 2 restates F-1 field 4.013,1 and check 5 restates SB4-1.3-04.4
Item 7 is the most mechanical. Its range checks restate SB4-1.3-09 and SB4-1.3-11 and its condition check restates F-1’s notes on 26.009, so each needs only arithmetic and the defects table. Item 6 also rests on policy text, since SB4-1.3-09 requires comments that say why sales got most, less or no weight, but checking it means matching a field against free-form commentary. Which check a lender automates first depends on where its own review findings cluster.
Research checked Oct. 17, 2026 against the GSE documents listed below. Months of supply, averages and rule results were calculated by ValuSignal from the sample reports’ published figures. The street, houses and porch are fictional and were generated with Higgsfield; the form pages and sample sections are screenshots of GSE publications. General information, not legal, lending or appraisal advice.
Sources
8 documents, accessed Oct. 16 to 17, 2026
- Fannie Mae and Freddie Mac, Appendix F-1: URAR Reference Guide, v1.4, chapters 17, 22 and 26 and the revision historyMarch 10, 2026
- Fannie Mae and Freddie Mac, Appendix D-1: URAR Sample Scenarios and XML Files, v1.4 (SF1 to SF4, Condo1, Condo2, Coop1, MH1, MH2, 2- to 4-unit)March 10, 2026
- Fannie Mae and Freddie Mac, Appendix D-1 sample reports, v1.2 (SF5 and 2- to 4-unit Scenario 2)Earlier D-1 package
- Fannie Mae, Selling Guide Supplement: UAD 3.6 Policy, SB4-1.3-03, SB4-1.3-04, SB4-1.3-09, SB4-1.3-10 and SB4-1.3-11Sept. 2, 2026
- Fannie Mae and Freddie Mac, Appendix G-1: Redesign to Legacy UAD Cross Reference Guide, v1.4Current package
- Fannie Mae and Freddie Mac, UAD Specification Appendix C: Form 1004/70 with numbered fieldsForm dated March 2005
- Fannie Mae and Freddie Mac, Appendix C-1: URAR layout, v1.3Current package
- Fannie Mae, Selling Guide Announcement SEL-2018-06: Market Conditions Addendum (Form 1004MC)Aug. 7, 2018
The Signal / Monthly briefing
Get the next UAD 3.6 analysis in your inbox.
One sourced briefing in the first week of each month on valuation policy, collateral risk and property technology.
Unsubscribe in one click. We don't sell your email or share it with sponsors. Privacy Policy