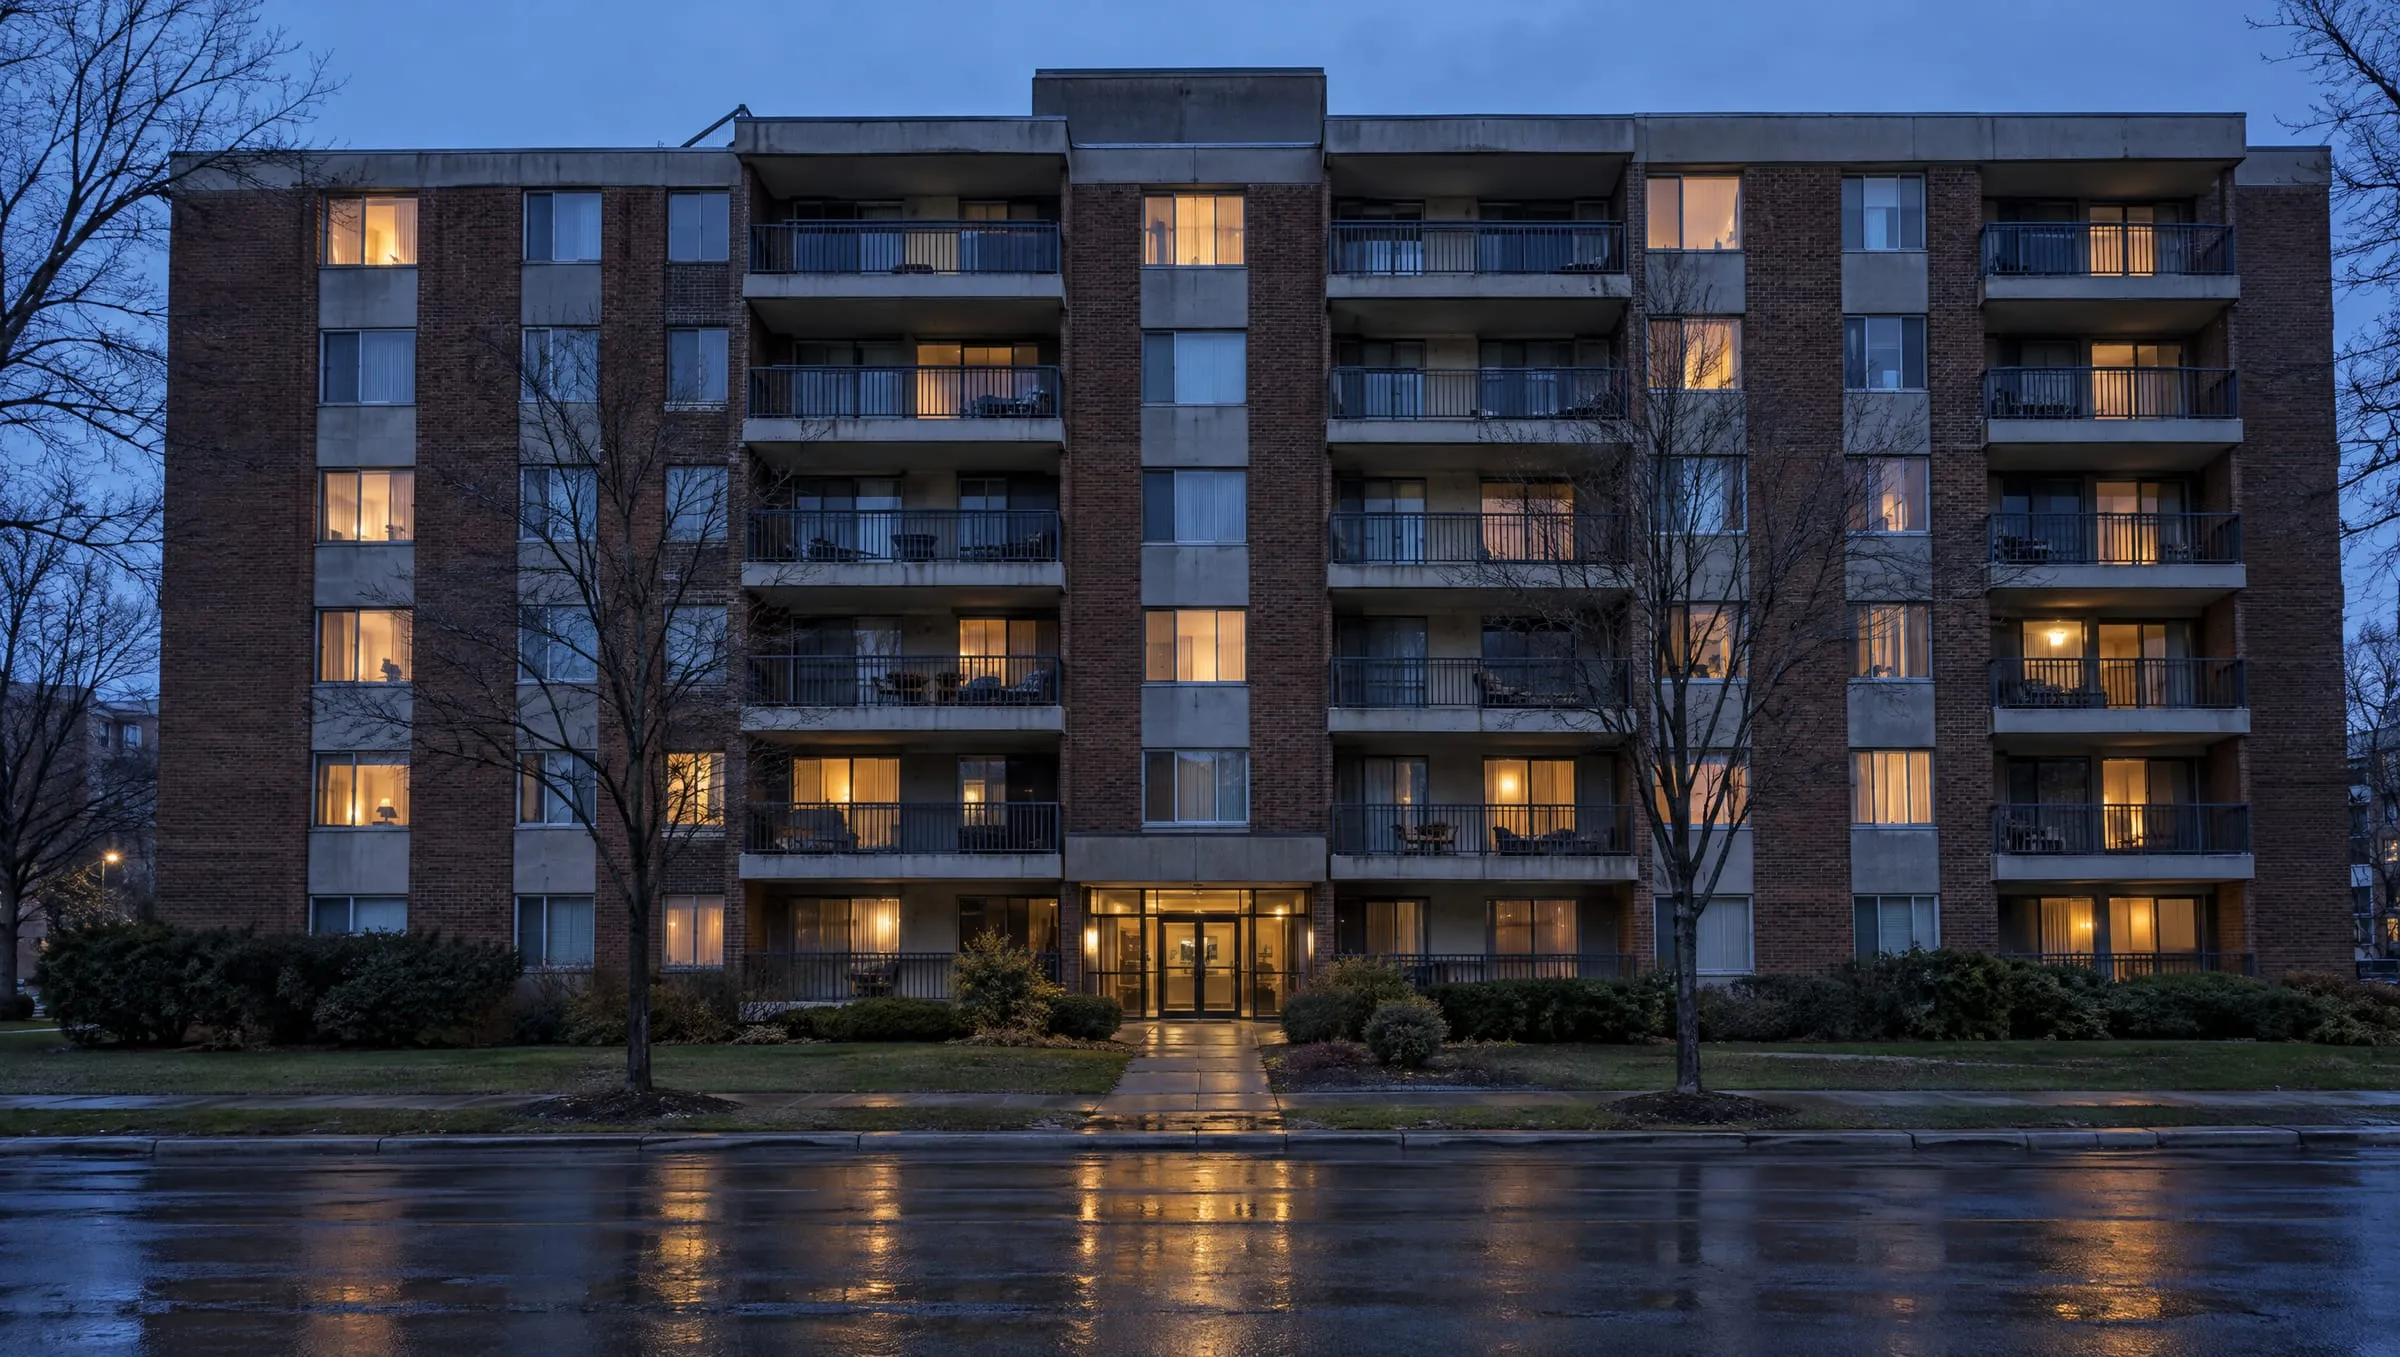
The Signal / Policy / November 2, 2026
Condo rules: what changed Aug. 3, what changes Jan. 4 and what the price data can’t say
Fannie Mae and Freddie Mac ended limited condo reviews on Aug. 3 and raise the reserve minimum to 15% for applications dated on or after Jan. 4, 2027. We compared five years of Dallas County condo and single-family sales to see where values stood before the rules arrived.
Key points
- Fannie Mae and Freddie Mac retired limited condo reviews for applications dated on or after Aug. 3, 2026. The reserve minimum rises from 10% to 15% of budgeted assessment income on Jan. 4, 2027. The same March letters loosened waivers and roof coverage.
- In Dallas County, condo price per square foot fell 5.1% from the first half of 2022 to the first half of 2026 while single-family fell 0.4%, with matched controls. Screened repeat sales show condos down 1.1% and houses up 7.8%. Condo supply reached 10.3 months against 5.4.
- Most of the decline sits in lower-priced buildings. Buildings with a 2021 to 2023 median under $150K fell 24.9%, and buildings at $400K and up rose 5.7%. Dues in the lowest tier run about 5.5% of sale price a year.
- These figures do not show that the rules caused the decline. Dallas County’s condo index peaked by the first half of 2024, and all 30 large metros that sit at least 10% below their condo peak reached it by May 2024, before the March 2026 letters.
Two aligned announcements
The March letters tighten project reviews and reserves, and loosen waivers, investor limits and roof coverage
On March 18, 2026, Fannie Mae issued Lender Letter LL-2026-03 and Freddie Mac issued Guide Bulletin 2026-C. Fannie Mae says its changes are aligned with Freddie Mac and coordinated with FHFA.12 Freddie Mac uses different names for the same steps: Streamlined Review where Fannie Mae says Limited Review, and Exempt From Review where Fannie Mae says Waiver of Project Review.2
Fannie Mae gives this reason for the reserve changes:
“Since then, we have seen a correlation between condo projects with underfunded reserves for capital expenditures and those in need of critical repairs.”
Fannie Mae, Lender Letter LL-2026-031
The letter adds that unit owners can face special assessments or higher dues “leading to mortgage default or foreclosure.”1
| Change | Direction | Effective |
|---|---|---|
| Limited Review retired; established projects go to Full Review or a waiver | Tighter | Aug. 3, 2026 |
| Reserve study path must fund the highest recommended allocation; baseline funding barred | Tighter | Aug. 3, 2026 |
| Replacement reserve minimum rises from 10% to 15% under Full Review | Tighter | Jan. 4, 2027 |
| Waiver of Project Review expanded to projects of 10 or fewer units | Looser | Immediately |
| 50% investor concentration limit retired on established projects | Looser | Immediately |
| Florida review requirement for new attached projects retired | Looser | Immediately |
| Roofs must be insured but need not be on a replacement cost basis | Looser | Immediately |
| Master policy per unit deductible capped at $50,000 | Changed | July 1, 2026 |
| Servicer insurance monitoring and annual borrower reminder | Changed | By Jan. 1, 2027 |
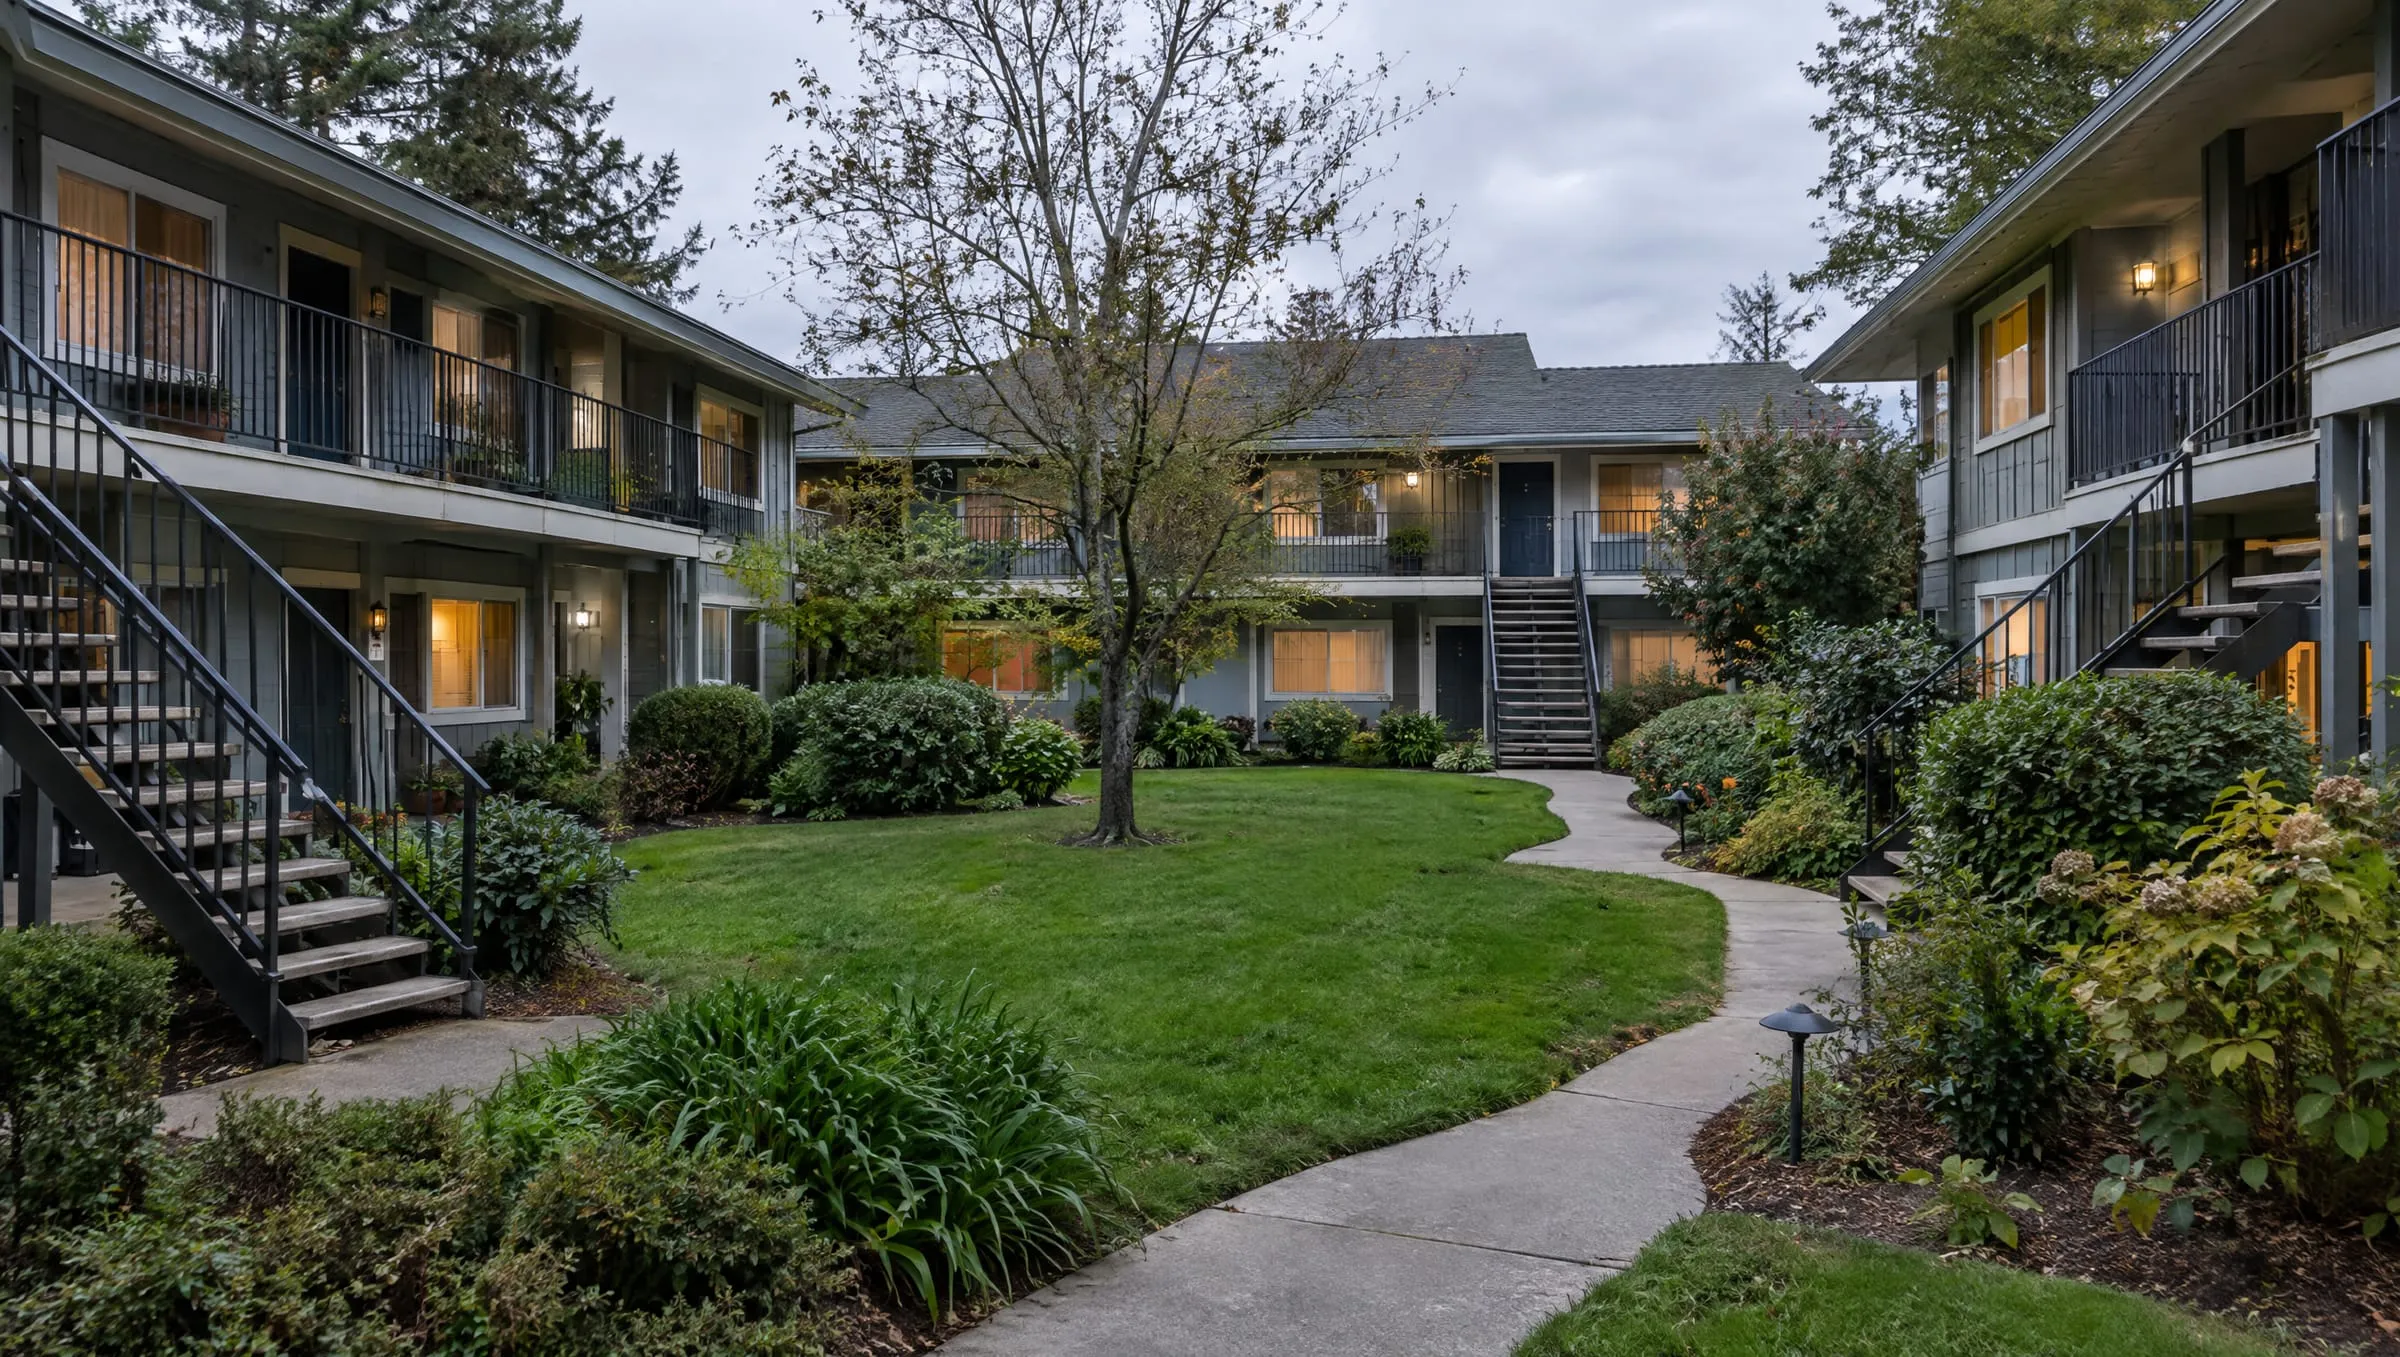
Pick a date and a project size
The loan application date and the project’s size decide which review and reserve minimum apply
The dates attach to the application, so two loans in one building can fall under different rules. Freddie Mac also says a Seller with an unexpired project review completed before the effective dates must still confirm that the project complies for applications received on or after them.2
Reserves of at least 15% of annual budgeted assessment income.
A reserve study path requires the budget to include the study’s highest recommended allocation. Baseline funding is not allowed.
All six combinations
| Application date | Project size | Review | Reserves |
|---|---|---|---|
| March 18 to Aug. 2, 2026 | More than 10 units | Limited Review or Full Review | Under Full Review, reserves of at least 10% of annual budgeted assessment income. |
| March 18 to Aug. 2, 2026 | 10 or fewer units | Waiver of Project Review may apply | No Full Review reserve test. The project must not have an “Unavailable” status in Condo Project Manager and must meet the insurance requirements. |
| Aug. 3, 2026 to Jan. 3, 2027 | More than 10 units | Full Review | Reserves of at least 10% of annual budgeted assessment income. |
| Aug. 3, 2026 to Jan. 3, 2027 | 10 or fewer units | Waiver of Project Review may apply | No Full Review reserve test. The project must not have an “Unavailable” status in Condo Project Manager and must meet the insurance requirements. |
| Jan. 4, 2027 and later | More than 10 units | Full Review | Reserves of at least 15% of annual budgeted assessment income. |
| Jan. 4, 2027 and later | 10 or fewer units | Waiver of Project Review may apply | No Full Review reserve test. The project must not have an “Unavailable” status in Condo Project Manager and must meet the insurance requirements. |
What the percentage measures
The 15% is a share of annual budgeted assessment income, and a reserve study remains a separate path
Under Full Review, the lender reads the association’s budget and checks the allocation for capital expenditures and deferred maintenance. The minimum moves from 10% to 15% of annual budgeted assessment income.1 Fannie Mae’s Selling Guide, dated Aug. 5, still shows 10%, because Fannie Mae said the new reserve standard would not enter the guide until after Jan. 4.34
The guide lets a lender “use a reserve study in lieu of calculating the replacement reserve,” provided the study was completed within three years of project approval.4 Since Aug. 3 the budget must also include the study’s highest recommended allocation, and baseline funding no longer counts.1 Freddie Mac’s FAQ says Sellers may rely on a reserve study instead of the budget percentage, and may submit a Project Waiver Request for established projects.5 The letter says other reserve requirements are unchanged, so we read the study path as continuing after Jan. 4. Fannie Mae has not yet published the revised guide text.
With every other budget line held fixed, a project that allocates exactly 10% today needs assessment income about 5.88% higher to reach 15%. At the $449 median we found on 2026 Dallas County condo listings, that is $26.41 a month. Use your own numbers below.15
The sign depends on the measure
National condo measures range from a 1.1% decline to a 1.2% gain, and none has condos ahead of single-family homes
ICE data given to CNN show condo prices down 1.1% from a year earlier in mid-October and single-family prices up 1.5%. Condos lagged in 99 of the 100 largest markets, and fell at least 3% in more than a quarter of them.6 Cotality’s attached category includes townhomes.7 NAR’s measure is a median sale price, which moves with the mix of homes sold, and it shows both categories up 1.2%.8
- Condo or attached
- Single-family or detached
Table
| Source | Measure | Condo category | Change | Single-family category | Change |
|---|---|---|---|---|---|
| ICE6 | Home price index, mid-October | Condo | -1.1% | Single-family | +1.5% |
| Zillow10 | Home value index, September | Condo | -0.1% | Single-family | +1.3% |
| Cotality7 | Home price index, August | Attached, including townhomes | +0.1% | Detached | +2.1% |
| NAR8 | Median sale price, September | Condo and co-op | +1.2% | Single-family | +1.2% |
NAR counted condo and co-op sales at an annual rate of 350,000 in September, down 5.4% from a year earlier.8 Its condo months’ supply averaged 3.5 in 2023, 4.8 in 2024 and 5.8 in 2025.9
The longer view uses Zillow’s home value index. In December 2019 the typical condo was valued at 1.041 times the typical single-family home. By September 2026 the ratio was 0.937. The U.S. condo series peaked in May 2024 and sits 2.1% below that level.10
50 largest metro areas
Condo values fell over the past year in 34 of the 50 largest metros and trailed single-family values in 49
Raleigh, NC (-7.6%), Tampa, FL (-6.9%), Las Vegas, NV (-6.5%) had the steepest year-over-year falls in this series. Dallas shows condos at -5.5% and single-family at -2.1%.10 Measures differ by metro: ICE has Seattle down nearly 7%,6 and Zillow has it at -4.3%.
- Condo
- Single-family
No metro found
Measured from each metro’s own condo peak, 30 of the 100 largest metros sit at least 10% below it, and 4 sit at least 20% below it.10 Dallas sits 14.1% below.
Five years, same methods
Dallas County condo values fell behind single-family homes after 2024, on both methods we tested
National indexes cannot show how a condo market behaves at the building level, so we ran one county through the same steps. We used Dallas County MLS sales records from Nov. 3, 2021 to Sept. 30, 2026: 10,940 closed condo sales and 86,890 closed single-family sales.15
The first method compares price per square foot with controls for zip code, building era, size and bedrooms. From the first half of 2022 to the first half of 2026, condos fell 5.1% and single-family homes fell 0.4%. The second follows the same unit or house across two sales, a smaller sample that drops short holds and most rehabs. It has condos at -1.1% and single-family homes at +7.8%. The gap is about 5 points on the first method and 9 on the second.
- Condo
- Single-family
Table and ranges
Change from first half of 2022 to first half of 2026, with the 5th to 95th percentile of 150 bootstrap draws. Matched controls: condo -5.1% (-8.3% to -0.9%), single-family -0.4% (-1.7% to +0.7%). Repeat sales: condo -1.1% (-3.6% to +1.5%) on 798 pairs, single-family +7.8% (+6.4% to +9.2%) on 3,966 pairs.
| Half-year | Condo | Single-family |
|---|---|---|
| 2021 second half | 89.1 | 89.8 |
| 2022 first half | 100 | 100 |
| 2022 second half | 104.1 | 98.9 |
| 2023 first half | 104.7 | 99.6 |
| 2023 second half | 107.5 | 101.3 |
| 2024 first half | 106.2 | 102.3 |
| 2024 second half | 104.6 | 101.8 |
| 2025 first half | 103.1 | 101.1 |
| 2025 second half | 96.7 | 98.6 |
| 2026 first half | 94.9 | 99.6 |
| 2026 second half | 92.4 | 99.1 |
| 2021 second half | 91.9 | 91.4 |
| 2022 first half | 100 | 100 |
| 2022 second half | 103.2 | 99.6 |
| 2023 first half | 105.9 | 101.9 |
| 2023 second half | 105.2 | 104.1 |
| 2024 first half | 108.5 | 105.6 |
| 2024 second half | 108.2 | 106.2 |
| 2025 first half | 104.3 | 107.5 |
| 2025 second half | 102.6 | 105.6 |
| 2026 first half | 98.9 | 107.8 |
| 2026 second half | 97.9 | 105.5 |
At the end of 2022, condos had 2.3 months of supply and single-family homes had 2.8. On Sept. 30, 2026, condos had 10.3 months and single-family homes had 5.4, with 1,501 condo listings active.
- Condo
- Single-family
The median condo closed at 94.2% of original list price over the last 12 months, against 100.0% in the first nine months of 2022. Single-family homes went from 101.3% to 96.4%.
One county, four price tiers
The largest condo declines sit in buildings that sold for under $250K in 2021 to 2023
We assigned each building to a tier by its median sale price in 2021 to 2023, so a later decline cannot move a building into a lower tier. Comparing sales within the same building, price per square foot fell 24.9% in buildings under $150K and 13.8% in buildings at $150K to $250K. It held about flat at $250K to $400K and rose 5.7% at $400K and up.15
| Building tier | Change, 2022 to 2026 | Range | From peak | Median dues | Dues per year, share of price | Cash sales |
|---|---|---|---|---|---|---|
| Under $150K | -24.9% | -27.8% to -21.6% | -27.2% | $338 | 5.5% | 71.2% |
| $150K to $250K | -13.8% | -16.2% to -11.6% | -20.3% | $411 | 2.8% | 40.8% |
| $250K to $400K | -0.4% | -3.1% to +2.5% | -9.3% | $544 | 2.2% | 42.7% |
| $400K and up | +5.7% | +2.4% to +8.2% | -4.5% | $749 | 1.5% | 54.3% |
Change compares the first half of 2022 with the first half of 2026. Dues and cash cover sales from Oct. 1, 2025 to Sept. 30, 2026.
Dues weigh most where prices are lowest. In the lowest tier, the median monthly dues of $338 come to 5.5% of sale price per year. At $400K and up, the higher $749 comes to 1.5%. Cash buyers made 71.2% of recent purchases in the lowest tier. These figures do not establish why prices fell.
Lower-priced homes were weaker on the single-family side as well. With zip and era cells sorted the same way, single-family values fell 6.5% under $250K and rose 10.0% at $700K and up. Those cells group many houses and are less precise than a building, so the two tier tables are not directly comparable.
Before any 15% test
Median Dallas County condo dues rose 29% from 2022 to 2026 listings
Across 2,632 pairs of listings for the same unit at least 11 months apart, dues rose a median 5.7% a year. In 28.0% of pairs they rose more than 10% a year, and in 24.5% they did not change. About 47% of listings say dues include insurance. Dues data do not show how much of any increase went to reserves.15
Cash buyers’ share of condo sales rose from 38.4% in the first quarter of 2022 to 46.6% in the third quarter of 2026. For single-family homes it went from 26.4% to 22.0%. Loans closing soon after Aug. 3 mostly had applications dated before it, so the table below is an early reading and cannot yet test the review change.
| Period | Condo sales | Condo cash | Condo conventional | Single-family cash | Single-family conventional |
|---|---|---|---|---|---|
| Aug. 3 to Sept. 30, 2026 | 285 | 47.4% | 46.3% | 23.1% | 48.8% |
| Aug. 3 to Sept. 30, 2025 | 302 | 47.4% | 45.0% | 20.7% | 51.4% |
| Aug. 3 to Sept. 30, 2024 | 333 | 40.5% | 52.9% | 21.3% | 53.2% |
Limits of this analysis
These data cannot separate the rules from supply, rates and earlier weakness
All 30 large metros that sit at least 10% below their condo peak reached that peak by May 2024, at least 22 months before the March 2026 letters.10 Dallas County’s matched index peaked in the second half of 2023 and its repeat-sale index in the first half of 2024.15 Nationally, 38 of the 100 largest metros reached their condo peak in 2026.
The national condo gap also did not visibly speed up after the letters. Zillow’s condo to single-family ratio fell 0.77 of a percentage point in the six months before them and 0.56 in the six months after. Lenders were not required to apply most of the review changes until Aug. 3, and the 15% minimum has not started, so these figures cannot rule out a later effect.
The March 2026 letters came out during the last column. A metro in that column may simply still be rising.
“Condos tend to underperform in a softer market because they are often the entry point to ownership, where demand reacts first to higher rates and prices, and new condo supply can be added quickly where construction has been heavy.”
Andy Walden, head of mortgage and housing market research, Intercontinental Exchange, to CNN6
MLS records do not show a project’s reserve allocation, its review outcome, its Condo Project Manager status, or whether a buyer’s loan was denied because of the project. Cotality links attached-home weakness to HOA fees, special assessments and insurance,7 and our Dallas County figures fit that description without proving it.
Unresolved in public
Trade groups asked for a one-year delay, and FHFA has said the GSEs will implement on time
In a July 8 letter to FHFA Director Bill Pulte and both GSEs, the Community Home Lenders of America, the Community Associations Institute and the National Association of Mortgage Brokers asked for a one-year delay on some restrictions. They also asked for exception processing on lower-risk loans, proportionate standards for critical repairs and repurchases, and alignment with FHA procedures.1112 Responding to an earlier request, FHFA said the GSEs were “implementing their new policies on time so that more Americans can afford to buy a home and everyone’s financial security is protected.”12 We found no FHFA decision on the July letter as of Nov. 2.
| Claim | Who says it | Basis given |
|---|---|---|
| A full review could cost some borrowers more than $1,000 extra11 | CHLA, CAI, NAMB | Groups’ estimate in their letter |
| About 40% of current reviews were limited reviews13 | CAI’s CEO, March 2026 | The CEO’s estimate |
| Ending limited reviews creates a level playing field across states, which Florida had lacked12 | FHFA; Rep. Byron Donalds | Policy position |
| The March updates are “meaningful progress”13 | MBA’s president and CEO | Refers mainly to the insurance rollbacks |
| Fewer than 10,000 associations would struggle, with dues up $15 to $30 per unit16 | FHFA, as described by NAMB | NAMB’s account of FHFA’s estimate |
The $15 to $30 range sits near the arithmetic in chapter 03 for dues around $250 to $500, for a project at exactly 10%. It says little about projects further below the minimum, or those whose studies call for larger allocations. Fannie Mae’s letter also describes rising premiums and limited insurance availability as a challenge for associations,1 which is the context for the insurance rollbacks.
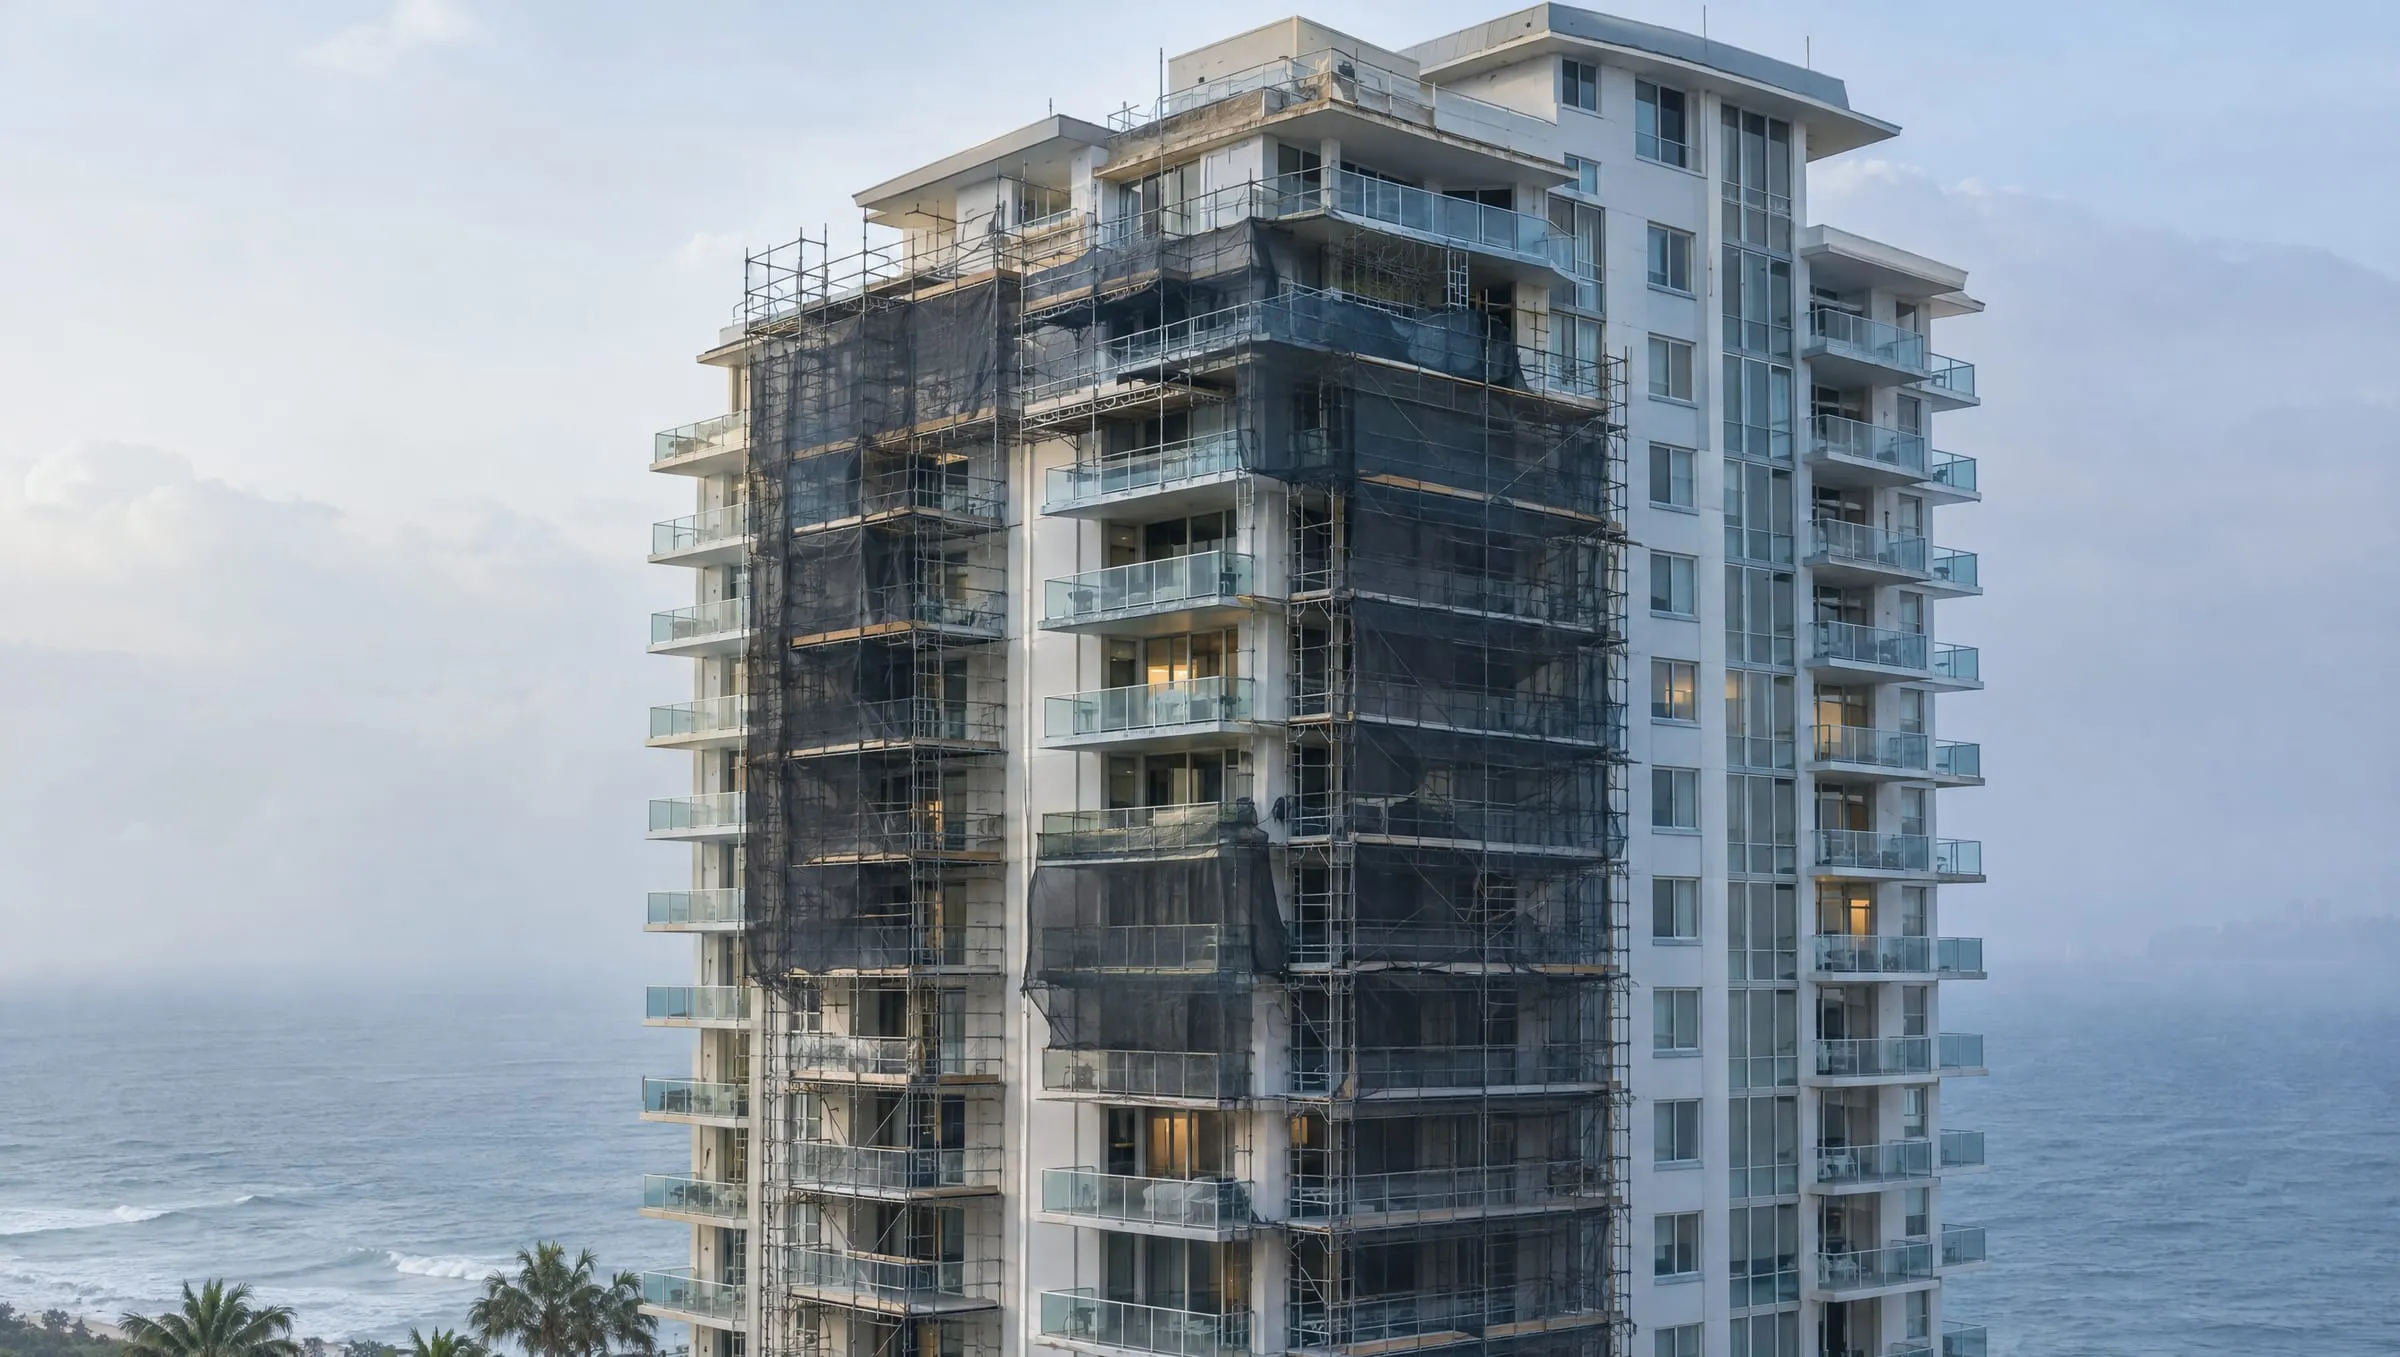
For collateral and valuation teams
Requirements and suggested checks before the reserve change takes effect
Items marked as requirements come from the GSE documents. Suggested checks are ours, drawn from the data above.
- RequirementSort the condo pipeline by application date. Applications dated on or after Jan. 4 need the 15% test under Full Review.1
- RequirementRecheck unexpired project reviews. Freddie Mac requires confirmation against the new requirements for applications on or after the effective dates.2
- RequirementDivide the reserve line by annual budgeted assessment income. Where a reserve study is used, confirm its date, that its funding method is not baseline and that the budget carries its highest recommended allocation.14
- RequirementConfirm waiver eligibility. Projects of 5 to 10 units must sit outside a master association or larger development, must not be “Unavailable” in Condo Project Manager and must meet insurance requirements.1
- SuggestedSplit condo portfolio and model results by building price tier. A county median hid a gap of about 30 points between the lowest and highest tiers in Dallas County.
- SuggestedRead comparable sales with their financing and dues. A cash sale in a project with limited financing and a conventional sale in an eligible one may not reflect the same buyer pool. UAD 3.6 reports project information in its own section of the dynamic URAR.
- SuggestedTrack months of supply and sell-through for condos separately. Dallas County condo supply ran nearly twice the single-family level in September 2026.
For why collateral value matters to how the GSEs price risk, see how Fannie Mae and Freddie Mac make money. Our October GSE update covers Freddie Mac’s condo flood coverage bulletin.
Method and limits
- Zillow. Metro Zillow Home Value Index files for condos and co-ops and for single-family homes, mid tier, smoothed and seasonally adjusted, through September 2026. “Largest” follows Zillow’s size ranking. We publish derived figures only.10
- Dallas County data. 20,343 unique condo listings, deduplicated by listing number. Closed sales at $15,000 or more from Nov. 3, 2021 to Sept. 30, 2026. Results are county and tier aggregates with at least 30 sales in each reported cell.15
- Matched controls. Log price per square foot on half-year indicators, log size and bedrooms, with fixed effects for zip code and building era, for 10,911 condo and 86,823 single-family sales. Tier results use a fixed effect for each building on 9,312 sales, with tiers set on 2021 to 2023 prices.
- Repeat sales. The same unit or house sold twice in the window, held at least a year, with an annualized move of no more than 25% to drop most rehabs. Pairs are few for condos, so half-years are the shortest period we report.
- Ranges. The 5th to 95th percentile of 150 bootstrap draws. They reflect sampling variation only.
- Supply and sell-through. Reconstructed from listing dates and status changes. A status change in the record can differ from the event date. Sell-through counts each unit once from its first listing in the period.
- Limits. Models do not observe renovation or condition. Dues and financing are as reported in listings. The condo and single-family comparison covers one county and may not apply elsewhere. No result here measures the effect of the rules.
This article is general information, not legal advice. Images marked as illustrations are AI-generated and do not show real projects. Dallas County tables and Zillow-derived figures are The Signal’s analysis; every other figure is from the cited source. Check the current GSE guides before applying any requirement to a loan.
Sources
- Fannie Mae, Lender Letter LL-2026-03, Updates to Project Standards and Property Insurance Requirements (March 18, 2026)
- Freddie Mac, Guide Bulletin 2026-C (March 18, 2026)
- Fannie Mae, Selling Guide Announcement SEL-2026-07 (August 2026)
- Fannie Mae, Selling Guide, Full Review Process (Aug. 5, 2026)
- Freddie Mac, Condominium Unit Mortgage FAQ (accessed Nov. 2, 2026)
- CNN, Condo sales prices are dropping, but new rules may complicate affordability (Intercontinental Exchange data) (Oct. 26, 2026)
- Cotality, US home price insights, October 2026 (Oct. 6, 2026)
- National Association of Realtors, Existing-home sales, September 2026 (Oct. 13, 2026)
- National Association of Realtors, breakouts of single-family, condo and co-op sales (May 11, 2026)
- Zillow Research, Zillow Home Value Index, metro condo and single-family series, mid tier, smoothed and seasonally adjusted (through Sept. 2026, accessed Nov. 2, 2026)
- HousingWire, Housing groups warn FHFA on GSE condo lending changes (July 9, 2026)
- National Mortgage News, Coalition escalates calls for delay on Fannie, Freddie condo rules (July 10, 2026)
- Scotsman Guide, FHFA revamps Fannie and Freddie condo insurance rules (March 19, 2026)
- Freddie Mac, Primary Mortgage Market Survey, 30-year fixed rate (Oct. 29, 2026)
- The Signal analysis of Dallas County MLS sales records, condo and single-family listings (closed sales Nov. 3, 2021 to Sept. 30, 2026)
- National Association of Mortgage Brokers, The Case for Pausing Fannie Mae Lender Letter LL-2026-03 (accessed Nov. 2, 2026)
The Signal / Twice-monthly briefing
Get the next data feature in The Signal.
One sourced briefing, twice a month.
Unsubscribe in one click. We don't sell your email or share it with sponsors. Privacy Policy
More from The Signal

What the EGRPRA hearings said about appraisal and valuation
Federal regulators held four EGRPRA outreach meetings. Appraisal came up in two spoken comments, and the written letters say more. A sourced summary.
AQB's third draft: Proposed changes to appraiser qualifications
The September 24 proposal revises appraiser education, experience, and assessment requirements. Compare the three drafts and read selected public comments.
Rural mortgage denials: what 10.7 million applications say about credit history and appraisals
FHFA blames high rural denial rates on credit history and appraisals. Our run of 10.7 million HMDA applications finds credit drives most of the gap.