The Signal / Practice / November 4, 2026
What a site is worth partway through approval
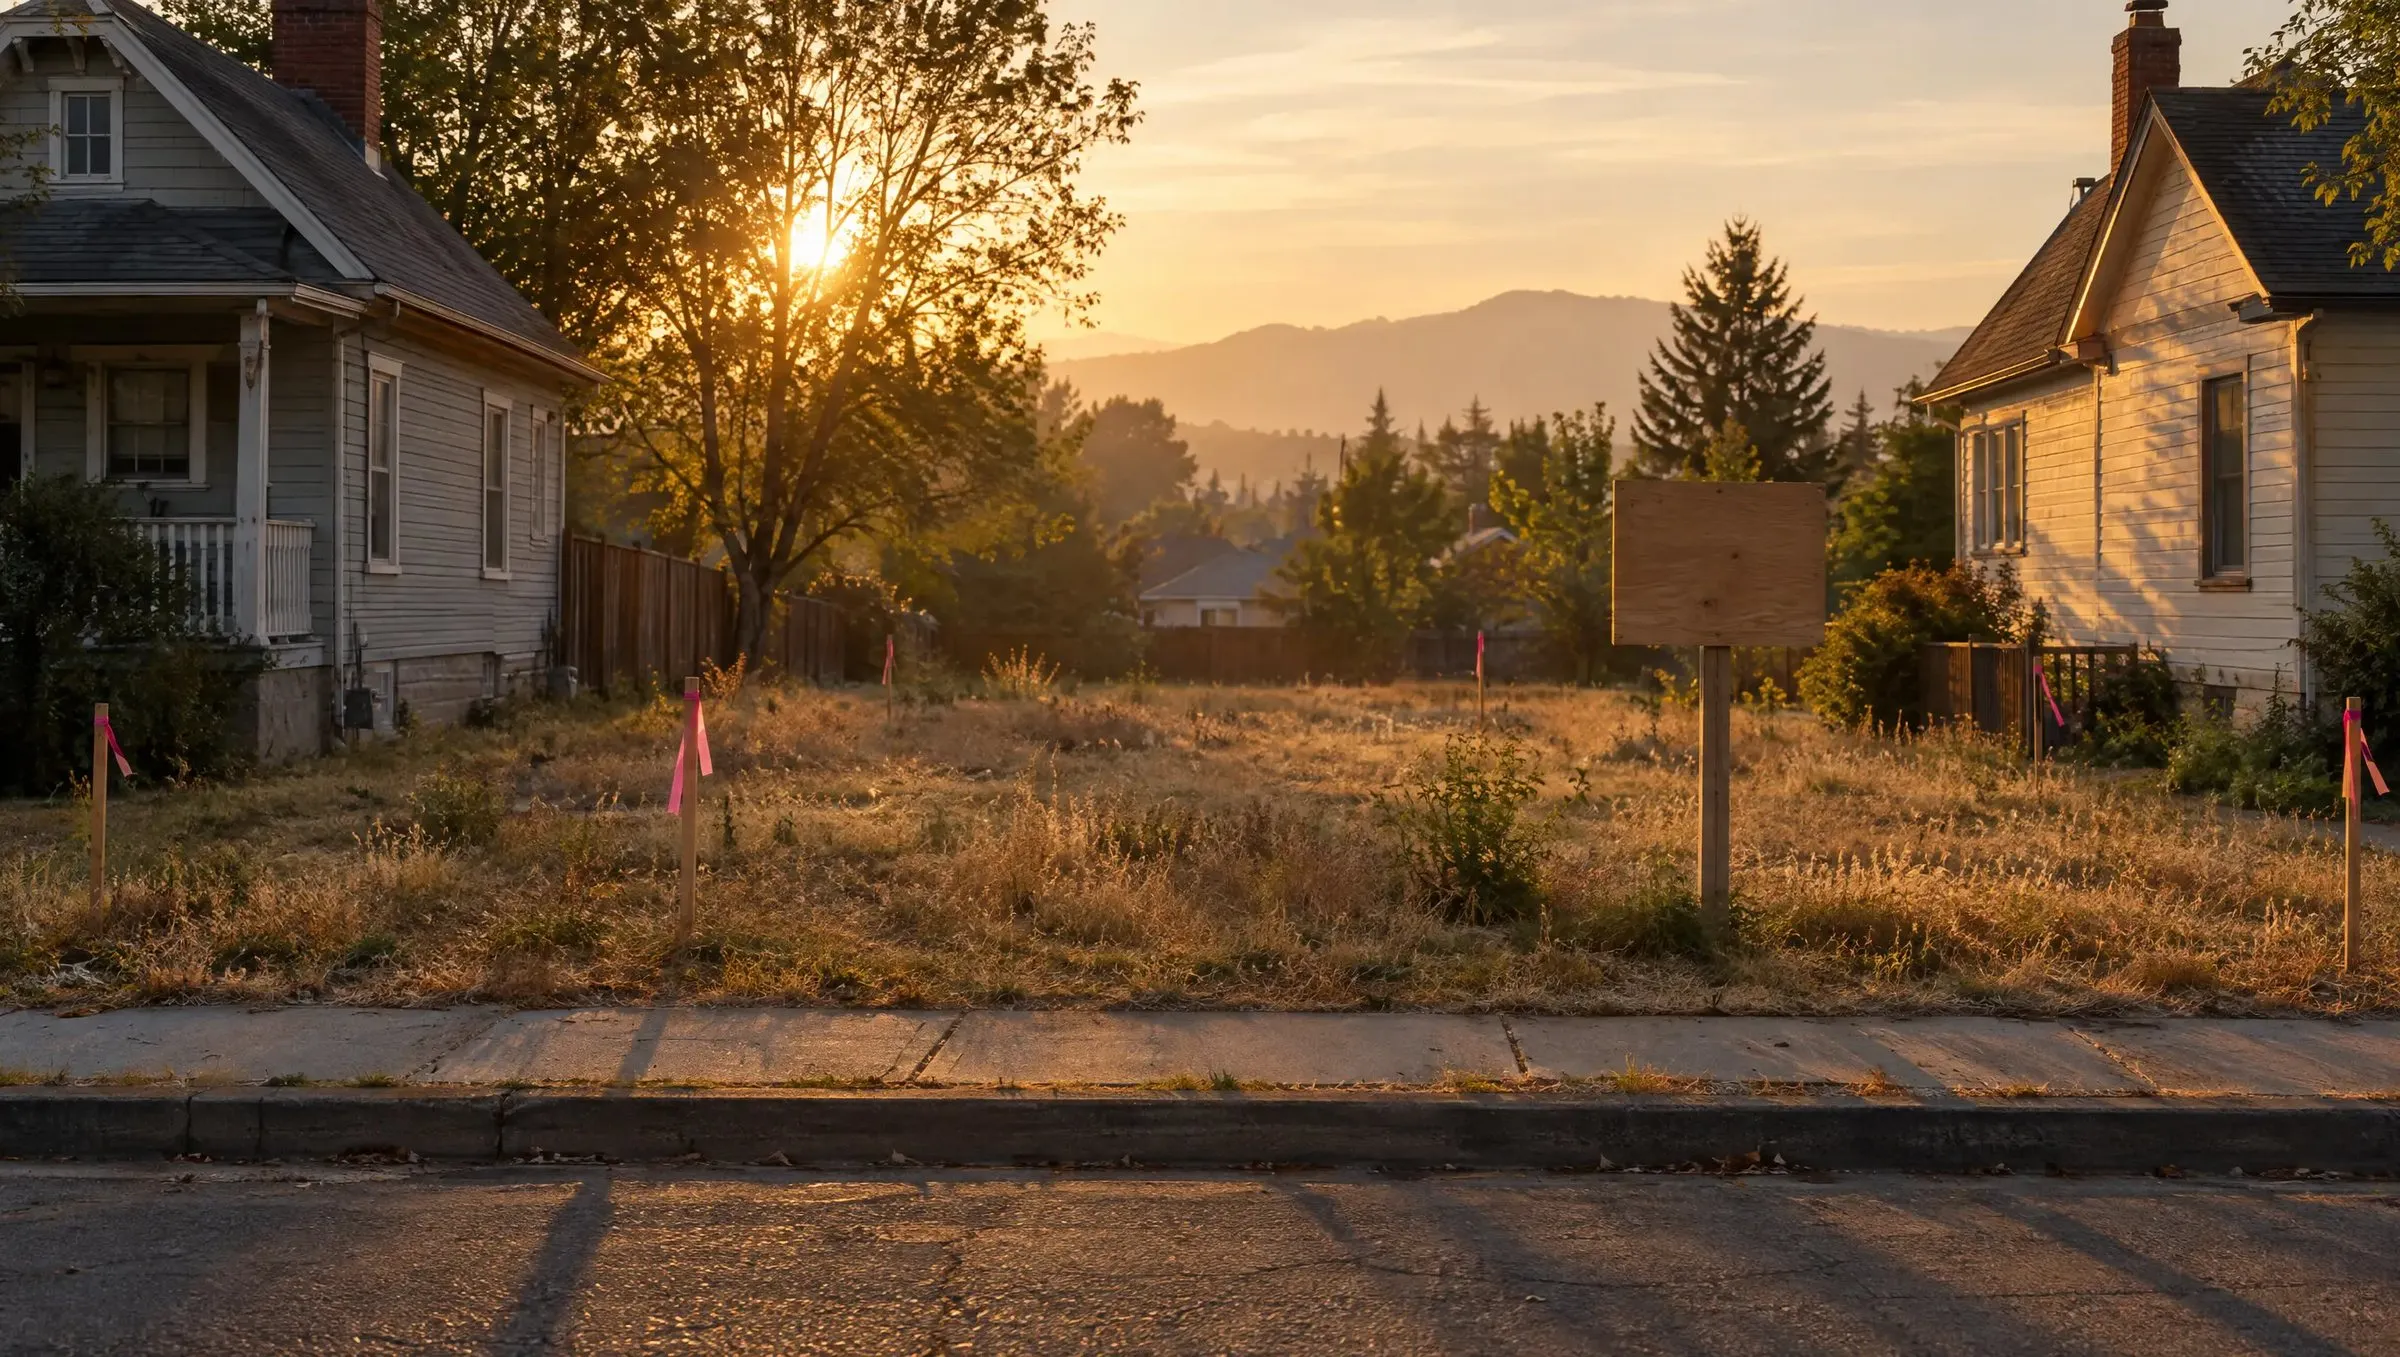
An infill lot worth $500,000 as raw land, $884,130 a year before its building permit, $1,084,100 the day the permit issues, and $500,000 again if the application lapses. Those are illustrative figures from a model this feature builds in the open, with the costs, the odds and the clock behind each step, and a look at why appraisal reports and valuation models both leave the question alone.
- $500,000Raw land
- $514,307Filed
- $674,669Approved
- $884,130Final
- $1,084,100Permit
Key points
- Value moves at milestones. An illustrative infill site rises from $500,000 raw to about $884,000 a year before its permit and $1,084,100 at issuance, then falls back to $500,000 if the application lapses. The formula and every input are shown.
- Residential reports seldom investigate the cases where zoning or entitlement changes the answer. AQB criteria keep subdivision analysis outside residential credentials, reviewers have described the checkbox habit since 2014, and Fannie Mae calls the analysis straightforward.
- In our run of 927,006 California progress report rows, 31 to 75 percent of entitlements approved 2018 to 2022 in seven large cities had no later building permit on the same parcel. San Francisco lists 47,444 entitled units with no permit application filed.
- Fannie Mae requires a zoning class and a highest and best use conclusion on the appraisal path and never mentions either in its value acceptance rules, so the AVM path skips the question by design. Where legal use drives price, model error should concentrate.
The question both paths skip
A site's legal future is priced by the market and left out by the two systems that value collateral
Land bankers hold entitled lots for public homebuilders at yields they publish each quarter. Developers pay option money for the right to buy a parcel once it clears rezoning. Councils reverse approvals and juries set the damages. Each of those is a price on the same thing: what a site is worth at a given point along the path from raw land to a building permit.
Two systems meet that question and set it aside. A residential appraisal report asks whether the present use is the highest and best use and, in most reports we review, answers yes with a template sentence. Automated valuation models learn from closed sales and tax records, neither of which records an approval stage, a condition of approval or an expiration date, and the rules that route a loan to a model skip the zoning checkpoint that the appraisal path requires.34
This feature builds the missing piece in the open. It walks a composite infill site through four milestones, prices each with a stated formula, and then fills the inputs with evidence: what approval costs, how often it fails, how a path closes after it is won, and how long permits take in the cities that publish usable data. Every illustrative number is labeled as one. The two original data runs, on California's housing progress reports and New York's zoning board records, come with their method and their limits.
What the report is supposed to hold
Residential reports owe a highest and best use rationale, and the exception cases are where it goes missing
USPAP's Standards Rule 1-3(b) requires an opinion of highest and best use when one is needed for credible results, and Standards Rule 2-2(a)(x) requires the report to summarize the support and rationale for that opinion.2 The legacy form gave the answer one checkbox. UAD 3.6 replaces it with four fields, one per test, plus commentary, which our SEL-2026-08 feature walks through with a Dallas residual land model.
Fannie Mae's own view is that the analysis is usually easy. Its September 2026 Playbook says that for most residential mortgage appraisals the analysis "is straightforward because the HBU is typically the property's present residential use as improved," and that it "becomes more important when a property's value potential includes an alternative use."6 Its FAQ adds that present use and highest and best use are "separate determinations."7 The ordinary house on the ordinary lot passes the four tests. The gap sits in the exceptions, where zoning has changed, a lot can be split, an accessory unit is possible or a use is legal nonconforming.
Reviewers have described the checkbox habit for years. Philip Spool wrote in 2014 that many residential appraisers "are content with checking the box 'yes'" and that a single paragraph covers all four tests.10 Russell Barrows wrote in 2018 that the analysis is "more than just checking the appropriate box on the form," and that he has reviewed reports citing residential zoning in towns that have no zoning at all.11 Illinois disciplined one appraiser in 2002 for a report that "misrepresented the zoning of the subject property" and another who "merely gave the definition of Highest and Best Use without doing the necessary analysis."12 The Appraiser Qualifications Board's criteria keep "subdivisions for which a development analysis/appraisal is necessary" outside the Licensed and Certified Residential scopes, and the required highest and best use coursework lists general topics with nothing on entitlement.1 The only training we found that prices a site mid-approval was a November 2025 Appraisal Institute litigation session.44
Legacy report
✓Present use is the highest and best useOne box. The rationale often reads as a definition.
Four tests, and where they turn
- 1Legally permissibleZoning class, legal nonconforming status, a pending rezoning, a lot-split right, an accessory unit allowance.
- 2Physically possibleLot size and shape, access, utilities, slope and floodplain.
- 3Financially feasibleWhether the alternative use returns more than it costs to reach, including the approval process itself.
- 4Maximally productiveWhether the alternative beats the present use by enough to justify the time and risk of getting there.
Where the evidence comes from
| Source | What it says | Year |
|---|---|---|
| Fannie Mae Playbook and FAQ | Analysis usually straightforward; present use and HBU are separate determinations | 2026 |
| AQB criteria | Subdivision development analysis sits outside residential credentials | 2026 |
| Working RE, Spool | Many residential appraisers check yes without the rationale | 2014 |
| NEREJ, Barrows | Reports cite zoning that does not exist; rezoned areas missed | 2018 |
| Illinois IDFPR | Two discipline cases: misrepresented zoning; definition without analysis | 2002 |
| Appraisal Institute litigation session | Staged entitlement modeling taught, as conference programming | 2025 |
Value moves at milestones
Value steps up when a risk resolves, and the step down on a lapse is the whole climb
The practitioner method for a development site values it as fully entitled and then deducts what remains: the cost still to be spent, the time still to run and a return on the money tied up. Thomas Jensen's article on appraising development sites lays that out for two end states, entitled and unentitled, and stops there.43 Real options research has priced the timing option in land for decades, with Laura Quigg finding an average option premium of about 6 percent of intrinsic value across 2,700 Seattle land sales,42 but it prices a single timing option rather than discrete approval stages. The published US sources we read stop at the two end states, so this model fills in the stages between them, with every assumption shown.
Vi = Pi × (VE − Ci) × Di + (1 − Pi) × VR
At stage i, P is the odds of reaching full entitlement from there, VE is the entitled value, C is the cost still to spend, VR is raw land value and D discounts the entitled branch for the years still to run at a required rate. Money already spent stays out of the value. It is equity at risk for the owner or the lender, and the table reports it on its own line. A lapse returns the site to VR and writes that equity off.
The California-style preset uses an entitled value of $1,100,000, a raw value of $500,000, a 15 percent rate and three years from filing to permit. Discounted, the site is worth $514,307 the day the application is filed, $674,669 once rezoning is approved, $884,130 when the final plat clears and its appeal period ends, and $1,084,100 at permit. Switch discounting off and the filing-stage figure rises to $665,000. Three years of carry at 15 percent eat most of the filing premium, so an application with a long clock ahead of it can sit near raw land value even with decent odds.
Stage table, with and without discounting
| Stage | Odds | Cost to go | Years to run | Value, discounted | Value, undiscounted | Equity at risk |
|---|---|---|---|---|---|---|
| Raw land | $500,000 | $500,000 | $0 | |||
| Application filed | 55% | $300,000 | 3 | $514,307 | $665,000 | $20,000 |
| Rezoning or preliminary approval | 80% | $150,000 | 2 | $674,669 | $860,000 | $70,000 |
| Final plat or site plan, appeals expired | 95% | $60,000 | 1 | $884,130 | $1,013,000 | $140,000 |
| Building permit issued | 99% | $10,000 | 0 | $1,084,100 | $1,084,100 | $200,000 |
Odds rise at milestones because each one removes a way to fail. Elapsed time on its own changes nothing in this model except the discount, which runs the other way.
The market gives the later stages a price. Millrose Properties, the land bank spun out of Lennar, reports a weighted average yield of 8.5 to 8.6 percent on about $6.4 billion of homesites held under option.28 Walton Global's public land banking fund targets 9 to 11.5 percent, with builder takedowns two to four years out.29 Forestar's arrangement with D.R. Horton lets it sell undeveloped land back within about a year at carrying value plus a 16 percent annual return, which prices a shorter and different risk.30 Builder option deposits run about 6 to 20 percent of the purchase price across the filings we read, with the downside capped at the deposit.31 Those yields fit the carrying cost of the last two rungs. They say little about the filing stage, where the odds, the cost and the clock all remain open.
The C in the formula
The layers with the most money in them are the ones the city keeps on denial
Remaining cost is a stack rather than a number. Impact and development fees are the largest layer in the states that charge them. The Terner Center's study of seven California cities put total development fees at 6 to 18 percent of the median new-home price, with Fremont charging $35,000 per single-family house,32 and the Duncan Associates survey put California's average impact fee on a standard house at $31,014, roughly double Maryland's.33 A full environmental impact report adds $150,000 to $300,000 in consultant fees on top of a state filing fee of about $4,100, a layer a by-right project skips.
The refund rules sort the layers. Building permit fees are commonly 75 to 90 percent refundable when a permit is canceled before work begins. Rezoning and entitlement application fees are kept on denial in the codes we read, and plan check and environmental review fees stay spent once the work is done. That is why sunk spending sits on the equity line and stays out of the market value.
- Pre-application studiesTraffic, environmental, geotechnical, surveyBefore filingKept on denial
- Design professionalsArchitect, civil engineer, plannerBefore and duringKept on denial
- Application and processing feesRezoning, variance, plat, site planAt filingKept on denial
- Environmental reviewCEQA or SEPA study and consultant feesDuring reviewKept on denial
- Attorneys and expeditersHearings, conditions, appealsDuring reviewKept on denial
- Carrying costInterest, taxes and insurance while waitingEvery monthKept on denial
- Impact and development feesSchools, roads, parks, utilitiesAt permitDepends on city
- Utility connection chargesWater, sewer, powerAt permitDepends on city
- Plan check and building permit feesThe last layer, after entitlementAt permitMostly refundable
Sourced figures behind the layers
| Figure | Amount | Source |
|---|---|---|
| Development fees, seven California cities | 6% to 18% of median new-home price | Terner Center, 201832 |
| Single-family fees, Fremont | $35,000 per house | Terner Center, 201832 |
| California average impact fee, standard house | $31,014 | Duncan Associates survey, 201233 |
| Environmental impact report consultant fees | $150,000 to $300,000 | Practitioner range, California |
| Building permit fee refund if canceled before work | 75% to 90% | Municipal fee schedules reviewed |
Denial is rare, failure is common
Boards rarely say no on the record, so every published approval rate overstates the odds of finishing
The best tracked program we found is Massachusetts Chapter 40B. Lynn Fisher's study followed 404 projects in 115 communities filed from 1999 to 2005. Local boards approved 81 percent and denied 19 percent. Developers appealed 90 percent of the denials, and 69 percent of those appeals produced a permit through a state ruling or a settlement. Roughly 90 percent of projects were approved in some form. By mid 2008 only 62 percent of the approved projects held a building permit.14
New York tells the same story at the rezoning stage. The Citizens Budget Commission tracked 171 private rezoning applications filed from 2014 to 2017 and found 60 percent approved after a median of two and a half years, with the rest withdrawn, pending or denied in proportions the summary does not split.41 A 2026 working paper that priced a standard 20-unit project across 60 cities found the chance of approval within six months fell from 71 percent in 2000 to 44 percent in 2025.15 That measures speed inside a window, which is a different thing from the chance of ever finishing.
Three adjustments stand between any of those rates and the P in the formula. Withdrawals have to be counted as failures, because an applicant who quits after two years lost the same money as one who was denied. The rate has to be rescaled for how discretionary the subject jurisdiction is compared with the one it came from. And the window has to match the stage: the odds of finishing from a filed application differ from the odds from an approved rezoning. The presets in the calculator start at 55 percent for a California-style discretionary site and 80 percent for a Texas-style by-right site. Both are assumptions to test, with the evidence here as the range.
Rates, with what each one measures
| Source | Rate | What it measures |
|---|---|---|
| Fisher, Chapter 40B14 | 81% approved locally; 62% of approved permitted by 2008 | Affordable override projects, Massachusetts, 1999 to 2005 |
| Citizens Budget Commission41 | 60% approved, median 2.5 years | Private NYC rezonings filed 2014 to 2017 |
| D'Amico, Soltas and Wang15 | 71% in 2000 to 44% in 2025 | Standard 20-unit project approved within six months, 60 cities |
| NYC Board of Standards and Appeals22 | 73.6% granted, 19.0% withdrawn, 3.3% denied | General variances since 1998, our query |
Our run of 927,006 rows
In seven large California cities, a third to three quarters of entitlements show no later permit on the same parcel
California requires every jurisdiction to report each housing project's entitlement, building permit and completion dates to the state, and the state publishes the table.21 We downloaded all 927,006 rows for 2018 through 2025, kept rows with a single parcel number, took every entitlement approved from 2018 to 2022, and looked for a building permit on the same parcel in the same city dated on or after the approval. A second, separate implementation of the join gave the same Los Angeles and San Diego results to the decimal.
Los Angeles matched 69.0% of 4,732 entitlement rows, with a median of 183 days from approval to permit. San Jose matched 25.2%. For Los Angeles, San Diego and Oakland the match rate holds roughly flat whether a cohort has had two years of runway or seven, which says the gap is mostly real rather than a matter of time. San Francisco and San Jose fall sharply for recent cohorts, so part of their gap is projects still in motion. Even San Francisco's 2018 cohort, with seven years to show a permit, matched only 54.3%.
A non-match has several explanations. Parcels get renumbered when a map records, multi-parcel projects are excluded by our rule, and data entry varies by city. Fresno matched 89.8% with a median of 15 days, which reads as entitlements and permits entered together, so it is left off the chart. The table shows that entitled and permitted are different statuses, and that the gap between them can be measured.
Match rate by entitlement year, Los Angeles and San Francisco
| City | 2018 | 2019 | 2020 | 2021 | 2022 | 2023 |
|---|---|---|---|---|---|---|
| Los Angeles | 69.8% (835) | 67.8% (953) | 66.0% (967) | 71.7% (1,072) | 69.6% (905) | 61.0% (861) |
| San Diego | 55.6% (81) | 56.2% (32) | 67.6% (37) | 53.6% (56) | 56.9% (51) | 63.8% (47) |
| Oakland | 63.9% (438) | 52.2% (437) | 50.0% (424) | 62.7% (426) | 55.3% (380) | 50.7% (347) |
| Sacramento | 28.0% (218) | 55.7% (244) | 53.6% (267) | 0.0% (346) | 65.5% (391) | 64.3% (283) |
| Long Beach | 66.7% (15) | 55.6% (9) | 64.5% (31) | 34.8% (23) | 53.3% (30) | 68.5% (89) |
| San Francisco | 54.3% (46) | 39.6% (48) | 27.3% (33) | 33.3% (54) | 17.9% (28) | 18.5% (27) |
| San Jose | 38.9% (18) | 25.0% (20) | 23.8% (21) | 35.3% (17) | 16.3% (43) | 6.2% (32) |
The 2023 column has at most two years of runway and is shown for the trend only.
San Francisco's planning department keeps its own count. Its mid-2026 pipeline report lists 75,853 units, of which 61,749 are entitled and 3,327 are under construction. Adding the department's two "no permit filed" categories gives 47,444 entitled units, 77 percent of the entitled stock, with no building permit application on file.20
- Entitled, no permit application filed: 47,444 (62.5%)
- Entitled, permit filed or issued, work yet to start: 10,978 (14.5%)
- Under construction: 3,327 (4.4%)
- Under review, entitlement pending: 14,104 (18.6%)
Pipeline table
| Stage | Units | Share |
|---|---|---|
| Entitled, no permit application filed | 47,444 | 62.5% |
| Entitled, permit filed or issued, work yet to start | 10,978 | 14.5% |
| Under construction | 3,327 | 4.4% |
| Under review, entitlement pending | 14,104 | 18.6% |
| Total | 75,853 | 100% |
Risk after the yes
An approval can be reversed, litigated or allowed to expire, and the probability term misses all three
The clearest dollar figure on a reversal comes from Alabaster, Alabama. A jury found a parcel worth $3,532,849.19 immediately before the city's December 2011 rezoning and $500,000 after it, an 86 percent drop, and the Eleventh Circuit affirmed the judgment in June 2021. The "before" figure was the developer's documented spending on the project, which the jury treated as the value lost.13 Most such suits fail; Alabaster won because the jury found the city acted unlawfully, and a referendum certified before the last discretionary approval usually leaves the developer with nothing to claim.
Litigation mostly adds time. Holland and Knight's review of 498 California appellate CEQA decisions from 2013 to 2023 found agencies winning 75 percent of appeals, 64 percent of challenged projects on infill sites and four to five years as the typical duration.16 For the model that belongs in the years-to-run and cost terms rather than the odds. Expiration is the third path. California tentative maps lapse 24 months after approval by default, with extensions capped at ten years.40 Texas vests a project's rules at its first permit application under Chapter 245, but a project that goes dormant can lose that protection, and many city site plans expire on their own schedule.39 The lapse row in the calculator is there for all three.
- ReversalAlabaster, Alabama. Rezoned Dec. 5, 2011; jury value from $3.53 million to $500,000; affirmed June 21, 2021.13
- LitigationCEQA appeals. 498 decisions, agencies win 75%, four to five years typical, 64% of targets infill.16
- ExpirationCalifornia tentative maps. 24-month default life, extensions capped at ten years.40
- VestingTexas Chapter 245. Rules freeze at the first permit application; dormancy can end the freeze.39
Measured where the data allows
Entitlement and permit run on separate clocks, and only a few cities measure either in a comparable way
Miami-Dade County's auditor tried to benchmark its permit times against other large jurisdictions in 2022. Four responded with usable data, and the office concluded that a comparison "could not be conducted due to the inconsistent permit types and non-homogeneous data provided."17 We hit the same wall in open data: New York's issuance table shows a median near zero days because the review lives in a separate dataset, and Austin's addition permits inherit application dates from master permits filed decades earlier. So the panels below stay small and carry their method.
The most careful comparison we found is a March 2026 report by San Francisco's Budget and Legislative Analyst, which pulled department data from six cities and warned that each presents its data differently.18 San Francisco's 280-day median includes entitlement time from before 2024; once the city split the clocks, permits filed and issued from January 2024 through August 2025 ran a median of 114 days, with the planning department's entitlement stage running about four months on its own. Denver and Washington report averages rather than medians, so the chart marks them differently. Austin, at 91 days, and San Diego, at 134, sit at the fast end.
- Median
- Average
Windows and notes by city
| City | Days | Statistic | Window | Note |
|---|---|---|---|---|
| San Francisco | 280 | median | Filed before Aug. 12, 2025, issued Jan. 1, 2024 to Aug. 12, 2025 | Includes entitlement time before 2024 |
| San Francisco, post-entitlement | 114 | median | Filed and issued Jan. 1, 2024 to Aug. 12, 2025 | Building permit stage only |
| Denver | 274 | average | Issued about Dec. 2024 to Dec. 2025 | |
| Seattle | 185 | median | Issued Jan. 1, 2024 to Oct. 6, 2025 | |
| San Diego | 134 | median | Issued Jan. 2025 to mid Dec. 2025 | |
| Washington, D.C. | 92.6 | average | Oct. 2024 to Sept. 2025 | |
| Austin | 91 | median | Issued Jan. 1, 2024 to Aug. 25, 2025 | Building permits |
Job type matters as much as city. Los Angeles publishes every permit with its application and issue dates, so we computed 2024 medians for one and two family work: 238 days for a new house, 129 for an addition and 20 for an alteration or repair.23 Discretion stretches the longer clock. A study of 350 Los Angeles multifamily projects found by-right projects reaching permit in a median of 477 days against 747 for projects that needed discretionary approval, and projects that required a full environmental impact report averaged 43 months to approval.19
- All one and two family permits
- Permits adding an ADU
Medians and counts
| Job type | Median days | Permits | ADU median days | ADU permits |
|---|---|---|---|---|
| New one or two family home | 238 | 3,309 | 211 | 1,887 |
| Addition | 129 | 5,013 | 168.5 | 1,861 |
| Alteration or repair | 20 | 32,541 | 106 | 2,411 |
Variances, historic review, ADUs
Boards grant most of what reaches a vote, and the cost sits in the year it takes and the conditions attached
New York City's Board of Standards and Appeals publishes every case with a real outcome field, which most permit systems lack. For the general variance under section 72-21, 1,983 cases since 1998 ended 73.6% granted, 19.0% withdrawn, 4.1% dismissed and 3.3% denied. For section 73-622, the special permit to enlarge a one or two family house that no longer meets the zoning, 631 cases ended 94.5% granted and 1.1% denied.22 Cases filed since 2015 took a median of 497.5 days to a grant for the general variance and 358.5 days for the house enlargement. Withdrawn cases ran a median of 501 days before they were pulled, about the same as the grants, so an applicant who gives up tends to do it late.
Historic review follows the same shape. Richmond, Virginia's Commission of Architectural Review decided 834 cases from 2018 through 2024 and denied 26, a 3.1 percent rate, while approval with conditions was the most common outcome in every year.25 New York's Landmarks Preservation Commission issued only 55 percent of its discretionary certificates within its own ten-day target in 2024, against 88 to 98 percent for its routine permit types.26 Accessory units show the gap between a statutory clock and a measured one. California gives cities 60 business days to act on an ADU application, about twelve weeks. San Diego's ADU permits issued in 2024 ran a median of 258 days from application, and Los Angeles ran 211 days for a new detached unit and 106 for a conversion.2324 Lot splits under SB 9 remain thin: Los Angeles had approved none of 28 applications by late 2022, while a few small suburbs approved most of theirs.27
- Granted
- Withdrawn
- Dismissed
- Denied
Outcomes and timelines
| Section | Cases | Granted | Withdrawn | Dismissed | Denied | Median days to grant, filed since 2015 |
|---|---|---|---|---|---|---|
| 72-21 | 1,983 | 73.6% | 19.0% | 4.1% | 3.3% | 497.5 (206 cases) |
| 73-622 | 631 | 94.5% | 3.3% | 1.1% | 1.1% | 358.5 (128 cases) |
Medians and counts
| City and cohort | Median days | Permits |
|---|---|---|
| San Diego, issued 2021 | 172.5 | 894 |
| San Diego, issued 2022 | 250 | 980 |
| San Diego, issued 2023 | 289 | 1,618 |
| San Diego, issued 2024 | 258 | 1,736 |
| Los Angeles 2024, ADU new build | 211 | 1,887 |
| Los Angeles 2024, ADU addition | 168.5 | 1,861 |
| Los Angeles 2024, ADU alteration | 106 | 2,411 |
For an appraiser or a reviewer looking at a planned addition, a conversion or a lot split, the evidence points one way. Outright denial is uncommon in every board we measured, between 1 and 5 percent of cases. The cost sits in the six months to two years the process runs, in the conditions attached to the yes, and in the share of applicants who quit late. A statutory clock describes the law and says little about the calendar.
Two paths, one checkpoint
The appraisal path requires a zoning class and a highest and best use conclusion, and the value acceptance path never asks
Fannie Mae's Selling Guide requires the appraisal to report the specific zoning class and to say whether the property is a legal conforming use, a legal nonconforming use, an illegal use or sits where there is no zoning, and it states that Fannie Mae "will only purchase or securitize a loan that represents the highest and best use of the site as improved."3 The eligibility rules for value acceptance, the program that replaces the appraisal with a model, list the loans that qualify and the ones that do not, and the list never mentions zoning, nonconforming use, accessory units or highest and best use.4 Vacant land and land development loans sit outside both GSEs' purchase rules altogether.58 The checkpoint exists on one path by design.
A model learns from closed sales and property records. Dye and McMillen's study of Chicago-area teardowns found that once a house becomes a teardown candidate, its structural characteristics stop explaining its price, because the price is the land; teardown rates ran above 9 percent of the housing stock in Winnetka against about 3 percent in Chicago.34 A model weighting square footage and bedroom count is modeling the wrong variables for that subset, and the subset clusters by neighborhood. Minneapolis's 2040 plan moved single-family prices about 3 to 5 percent, concentrated in land value and on the policy signal before adoption, in the one peer-reviewed study we found.35 A model that learns from accumulating comparable sales catches that late, and in cities where capitalization was weaker it has nothing to catch.
The industry's own record points the same way. Of five AVM-industry comment letters on the 2024 quality control rule that we read in full, none mentions zoning, highest and best use, land value or teardowns, though HouseCanary asked regulators to require validation by property segment.37 Clear Capital's glossary names "large acreage" among the traits that lower a confidence score.36 The rule itself defines a dwelling as a one to four unit residential structure and says nothing about land.38 Freddie Mac's appraisal guide requires at least one comparable with an accessory unit for a compliant ADU and two for a non-compliant one, and says that "to simply ignore the ADU due to lack of comparable sales is an unacceptable appraisal practice."9 Freddie Mac's collateral tool has carried a message since 2015 that fires when present use is not the highest and best use.45 Each of those rules is written for the appraisal path. Published measures of model error for teardowns, upzoned parcels or lot-split candidates have yet to appear, so this chapter describes a mechanism rather than a rate.
What each guide section says
| Section | Requirement |
|---|---|
| B4-1.3-04, Site section3 | Report the zoning class; state legal conforming, legal nonconforming, illegal or no zoning; improvements must represent the highest and best use as improved |
| B4-1.4-10, Value acceptance4 | Eligibility by loan purpose, occupancy, property type, LTV and price; zoning, nonconforming use, ADUs and highest and best use are absent |
| B2-3-01 and Freddie Mac 5601.258 | Vacant land and land development properties are ineligible for purchase |
| AVM rule, 89 FR 6453838 | Applies to models valuing a consumer's principal dwelling, a one to four unit residential structure |
The model, with the inputs exposed
Set the entitled value, the raw value, the odds and cost at each stage, and the clock
Two presets load the illustrative inputs: a California-style discretionary track with three years to run and a Texas-style by-right track with nine months. Both use the same arithmetic. Odds must rise or hold from one stage to the next, cost and years must fall or hold, and the entitled value must sit above raw land; the table keeps its last valid numbers and names the problem when an input breaks a rule. Without JavaScript, the table shows the California preset: $514,307 at filing, $674,669 at approval, $884,130 at final plat and $1,084,100 at permit, with raw land at $500,000.
| Stage | Value | If it lapses here | Equity at risk |
|---|---|---|---|
| Raw land | $500,000 | ||
| Application filed | $514,307 | $500,000 | $20,000 |
| Rezoning or preliminary approval | $674,669 | $500,000 | $70,000 |
| Final plat or site plan, appeals expired | $884,130 | $500,000 | $140,000 |
| Building permit issued | $1,084,100 | $500,000 | $200,000 |
Texas-style preset, undiscounted: $772,000 at filing against $500,000 raw, with an entitled value of $900,000. The gap between presets is the inputs, mainly odds and years, since the arithmetic is the same.
Questions the file should answer
What to ask about a partially entitled site, and about a house whose value rests on a planned change
Items marked as requirements come from the guides cited. The rest are our suggestions, drawn from the evidence above.
- RequirementConfirm the zoning class and use status in the report. Legal conforming, legal nonconforming, illegal or no zoning, with the class named, and a highest and best use conclusion with its rationale.23
- RequirementTreat vacant land and land development collateral as outside GSE purchase rules. Value acceptance does not reach them, so the valuation rests on the appraisal and the sponsor's assumptions.45
- SuggestedName the stage. Filed, approved, final with appeals expired, or permitted, with the date of each and the body that granted it.
- SuggestedList every condition of approval with its deadline. Conditions are where approvals lapse. Record the map or site plan expiration date and any extension already used.3940
- SuggestedAsk whether vesting is active. In Texas, the first permit application date and any dormancy; in California, the vesting tentative map and any later development agreement.39
- SuggestedSeparate spent money from value. An as-entitled value with the sponsor's spending added back is a cost basis, as the Alabaster jury's "before" figure was.13
- SuggestedPrice what the next milestone resolves. Ask which risk it removes and what the required return does to the entitled branch over the years still to run.
- SuggestedCheck for pending litigation and ballot measures. A referendum certified before the last discretionary approval can end a project with no compensation.16
For appraisers
- SuggestedWrite the four tests for the exception cases. A pending rezoning, a lot-split right, an ADU allowance or a nonconforming use each deserves a paragraph rather than a box.67
- SuggestedGive the ADU its comparables. One with an ADU for a compliant unit, two non-compliant ones for a non-compliant unit, per Freddie Mac.9
- SuggestedReport the permit status of any planned or completed change, with the application date, so the reader can weigh the months the data above describes.2223
Our development-site report shows an entitlement adjustment supported by before-and-after approval sales, and our Washington upzoning feature covers what a statewide rezoning does to comparable selection.
Method and limits
- Model. V = P × (entitled − cost to go) × discount + (1 − P) × raw, per stage. Presets are illustrative. The discount applies 1 ÷ (1 + rate) to the power of the years still to run, to the entitled branch only.
- California progress reports. HCD's Table A2 export, 927,006 rows, 2018 to 2025, downloaded Nov. 3, 2026. Rows with one parcel number; entitlements approved 2018 to 2022; earliest later building permit on the same jurisdiction and parcel. Fresno is reported but left off the chart as a reporting artifact. Two implementations of the join agree.21
- New York zoning board. Board of Standards and Appeals open data, cases since 1998, counted by final status; medians for cases filed since Jan. 1, 2015, in calendar days from filing to decision.22
- Los Angeles and San Diego permits. Medians in calendar days from application to issuance for permits issued in the year shown, with the job-type filters named in the captions. Elapsed days include time the file sat with the applicant.2324
- Six-city table. Reproduced from the Budget and Legislative Analyst's report with its own window and statistic for each city. It is a comparison of published figures, not a ranking.18
- Limits. A non-match in the California data is not proof of failure. Approval rates from other programs need adjustment before they stand in for one site's odds. Model error on land-driven properties and the share of entitlements that expire both lack published measures. Fee figures are from the cited studies and schedules and vary by city.
This article is general information, not legal or valuation advice. Images marked as illustrations are AI-generated and show no real property. The California, New York, Los Angeles and San Diego tables are The Signal's analysis of public data; every other figure is from the cited source. The model's presets are illustrative and do not describe any real site.
Sources
- Appraiser Qualifications Board, Real Property Appraiser Qualification Criteria (January 2026 edition)
- The Appraisal Foundation, Uniform Standards of Professional Appraisal Practice (2024 edition)
- Fannie Mae, Selling Guide B4-1.3-04, Site Section of the Appraisal Report (accessed Nov. 3, 2026)
- Fannie Mae, Selling Guide B4-1.4-10, Value Acceptance (Appraisal Waiver) (accessed Nov. 3, 2026)
- Fannie Mae, Selling Guide B2-3-01, General Property Eligibility (accessed Nov. 3, 2026)
- Fannie Mae, The Highest & Best Use Playbook, Uniform Appraisal Dataset 3.6 (September 2026)
- Fannie Mae, Highest and Best Use FAQs (September 2026)
- Freddie Mac, Accessory Dwelling Units fact sheet (February 2026)
- Freddie Mac, A Practical Guide to Appraising Accessory Dwelling Units (Sept. 9, 2026)
- Philip Spool, Highest and Best Use Analysis, Working RE (Summer 2014)
- Russell Barrows, Residential highest and best use pitfalls, New England Real Estate Journal (Feb. 9, 2018)
- Illinois Department of Financial and Professional Regulation, Real Estate Appraisal disciplinary actions, 2002 (2002)
- South Grande View Development Co. v. City of Alabaster, No. 18-14044 (11th Cir.) (June 21, 2021)
- Lynn Fisher, Chapter 40B Permitting and Litigation, Rappaport Institute policy brief (November 2008)
- D'Amico, Soltas and Wang, Where Is Housing Slow to Build, Princeton CEPS Working Paper 357 (September 2026)
- Holland & Knight, Why California Can't Build Reliable and Affordable Essential Projects (September 2026)
- Miami-Dade County Office of the Commission Auditor, Building Permit Process Report (Nov. 14, 2022)
- San Francisco Budget and Legislative Analyst, Post-Entitlement Permitting in San Francisco (March 5, 2026)
- California YIMBY, Dysfunctional Metropolis: Housing Permitting in Los Angeles (June 2023)
- San Francisco Planning, Housing Production and Development Pipeline, 2026 Q2 (July 2026)
- California HCD, Housing Element Annual Progress Report data by jurisdiction and year, Table A2 (downloaded Nov. 3, 2026)
- NYC Open Data, Board of Standards and Appeals Applications Status (queried Nov. 3, 2026)
- Los Angeles Department of Building and Safety, Building Permits Issued from 2020 to Present (queried Nov. 3, 2026)
- City of San Diego, Permit Approvals (ADU) layer (queried Nov. 3, 2026)
- City of Richmond, Commission of Architectural Review, 2024 annual report (February 2025)
- NYC Comptroller, Final letter report on the processing of permit applications by the Landmarks Preservation Commission (2025)
- Terner Center, SB 9 Turns One: Applications and Approvals (January 2023)
- Millrose Properties, second quarter 2026 results (Aug. 4, 2026)
- Walton Global, $250 million land banking fund offering (July 17, 2025)
- Forestar Group, Form 10-K for fiscal 2025 (Nov. 2025)
- Meritage Homes, Form 10-K for 2018 (Feb. 2019)
- Terner Center, It All Adds Up: The Cost of Housing Development Fees in Seven California Cities (March 2018)
- NAHB Eye on Housing, Home building impact fees: state averages (Duncan Associates survey) (Jan. 2014)
- Lincoln Institute of Land Policy, Teardowns (Dye and McMillen) (2007)
- Daniel Kuhlmann, Upzoning and Single-Family Housing Prices, Journal of the American Planning Association 87(3) (2021)
- Clear Capital, AVM Testing: A Short Glossary (accessed Nov. 3, 2026)
- HouseCanary, comment letter on Quality Control Standards for Automated Valuation Models (July 26, 2023)
- Federal Register, Quality Control Standards for Automated Valuation Models, final rule, 89 FR 64538 (Aug. 7, 2024)
- Texas Local Government Code, Chapter 245, Issuance of Local Permits (accessed Nov. 3, 2026)
- California Government Code section 66452.6, tentative map expiration (accessed Nov. 3, 2026)
- Citizens Budget Commission study of private rezoning applications, reported by The Real Deal (Sept. 7, 2022)
- Laura Quigg, Empirical Testing of Real Option-Pricing Models, Journal of Finance 48(2) (1993)
- Thomas Jensen, Appraising Development Sites: With and Without Entitlements, New England Real Estate Journal (2019)
- Appraisal Institute Litigation Conference, Land Use Issues Affecting Valuation (SCCAI) (November 2025)
- Valuation Review, Freddie announces appraisal changes to the UCDP (message FRE1095) (April 29, 2015)
The Signal / Twice-monthly briefing
Get the next data feature in The Signal.
One sourced briefing, twice a month.
Unsubscribe in one click. We don't sell your email or share it with sponsors. Privacy Policy