The Signal / Practice / November 14, 2026
Foreclosures from a low floor: Dallas County’s bank-owned sales and the habit of calling every market stable
Foreclosures are rising nationally from record lows. In Dallas County they are concentrated among low-priced homes bought in 2022 and 2023, while appraisals in the metro have checked stable on most reports for a decade.
Key points
- From January through October 2026, 226 Dallas County single-family homes sold through the MLS as bank-owned, 1.60% of closings, against 0.64% in the same months of 2024. In 2008 the share was about one sale in three.
- Under $300,000 the bank-owned share reached 3.56%, and bank-owned homes sold at 76% of their zip code’s standard price per square foot, down from 84% in 2024. Above $500,000 the share stayed near 0.4%.
- Over the 12 months to October, price per square foot fell 3.2% under $300,000 and rose 4.2% above $500,000. A county-wide reading of −2.2% averages the two, which is why Fannie Mae requires the trend for competitive properties.
- Dallas-area appraisals for Fannie Mae and Freddie Mac loans checked stable on 87% of reports in 2023. Contracts, unsold listings, concessions and months of supply all weakened from October 2024 to October 2026.
0.64% of closings in 2024, 1.60% in 2026
Bank-owned sales have more than doubled their share of Dallas County closings in two years
From January through October 2026, 226 single-family homes in Dallas County sold through the MLS as bank-owned, 1.60% of 14,127 closings. In the same ten months of 2024 the figure was 94, or 0.64%. In October alone, 32 of 1,189 closings were bank-owned, 2.7%, against 1.0% a year earlier and 0.28% in October 2024.
The share is still small. In 2008, 35% of the county's MLS sales were bank-owned, about one in three, and it stayed above 30% through 2011. Today's rate is about 1 in 63. What has changed is the direction and where the sales are. Most are in the lowest price range, and the largest group we could trace to an earlier sale was bought in 2022 and 2023.
* January to October. The 2004 to 2012 shares come from the same MLS field in older records; the method section covers the check on that coding.
Data table
| Year | Closings | Bank-owned | Share | Short sales |
|---|---|---|---|---|
| 2004 | 23,922 | 3,461 | 14.47% | 0 |
| 2005 | 25,220 | 3,593 | 14.25% | 0 |
| 2006 | 25,639 | 4,270 | 16.65% | 0 |
| 2007 | 24,053 | 5,652 | 23.50% | 0 |
| 2008 | 20,527 | 7,139 | 34.78% | 0 |
| 2009 | 17,714 | 5,895 | 33.28% | 0 |
| 2010 | 16,011 | 5,209 | 32.53% | 4 |
| 2011 | 15,741 | 4,987 | 31.68% | 339 |
| 2012 | 17,911 | 4,464 | 24.92% | 601 |
| 2021 | 22,501 | 67 | 0.30% | 27 |
| 2022 | 19,083 | 88 | 0.46% | 7 |
| 2023 | 16,886 | 80 | 0.47% | 6 |
| 2024 | 17,295 | 111 | 0.64% | 7 |
| 2025 | 17,162 | 153 | 0.89% | 26 |
| 2026 (Jan. to Oct.) | 14,127 | 226 | 1.60% | 24 |
The pipeline points up. Listings flagged as bank-owned, short sale or pre-foreclosure went from 42 in the first quarter of 2024 to 124 in the third quarter of 2026, and short-sale listings from 4 to 29. A distressed listing usually closes one to three months after it goes on the market, so the listings lead the closings.
- Distressed closings
- New distressed listings
Data table
| Quarter | Closings | Bank-owned | Short sales | All distressed | New distressed listings |
|---|---|---|---|---|---|
| Q1 2024 | 3,855 | 31 | 2 | 34 | 42 |
| Q2 2024 | 4,896 | 37 | 2 | 43 | 59 |
| Q3 2024 | 4,467 | 22 | 0 | 24 | 68 |
| Q4 2024 | 4,074 | 21 | 3 | 25 | 53 |
| Q1 2025 | 3,758 | 32 | 5 | 37 | 74 |
| Q2 2025 | 4,947 | 43 | 7 | 53 | 85 |
| Q3 2025 | 4,474 | 37 | 9 | 46 | 94 |
| Q4 2025 | 3,975 | 41 | 5 | 47 | 110 |
| Q1 2026 | 3,614 | 65 | 3 | 70 | 114 |
| Q2 2026 | 5,015 | 66 | 8 | 75 | 125 |
| Q3 2026 | 4,308 | 63 | 10 | 73 | 124 |
MLS counts understate foreclosures. In Texas, foreclosed homes are sold at a county courthouse auction on the first Tuesday of the month.24 Investors buy some at the auction; the rest go back to the lender and reach the MLS months later, if at all. ATTOM counted 402 completed foreclosures in the Dallas metro area in August 2026 alone,3 against about 20 bank-owned resales a month on the Dallas County MLS. The MLS figure measures the bank-owned homes that come back to market as listed resales, the ones an appraiser is most likely to see as comparables.

0.26% of U.S. housing units in 2025, 2.23% in 2010
Foreclosures nationally are up for a second year, at about a tenth of the 2010 rate
ATTOM, which tracks foreclosure filings in more than 3,000 counties, counted 367,460 U.S. properties with a filing in 2025, up 14% from 2024. That was 0.3% of all housing units, against 0.4% in 2019 and 2.2% in 2010, when nearly 2.9 million properties had a filing.1 The first half of 2026 brought 227,548 more, up 21% from a year earlier.2
Loan-level data show the same turn. In ICE's servicing data for September 2026, the number of loans in active foreclosure was up 37% from a year earlier, the most since early 2019, and completed foreclosure sales were up 15%. Loans made in 2022 or later accounted for 43% of new foreclosures and 49% of completed sales.7 The Mortgage Bankers Association put 0.67% of loans in foreclosure at mid-2026, up 0.19 percentage points in a year, against a record of about 4.6% in 2010.23 Its survey found 11.8% of FHA loans delinquent, against 2.7% of conventional loans.8 The New York Fed counted about 62,000 people with a new foreclosure on their credit report in the third quarter, more than in the second.9
Each source counts something different: ATTOM counts properties with a recorded filing against all housing units, ICE and MBA count mortgages, and the New York Fed counts consumers. They agree on the direction and the scale. Foreclosures are rising from the lowest levels ATTOM has recorded, and the increase is concentrated in FHA loans and in loans made after prices and rates peaked.
162 of 226 bank-owned sales in 2026
Under $300,000, bank-owned homes are 3.6% of sales and sell at a widening discount
In 2026, 162 of the 226 bank-owned sales through October closed under $300,000. In that range the bank-owned share went from 1.35% in 2024 to 3.56%. From $300,000 to $500,000 it went from 0.34% to 0.93%, and above $500,000 it stayed near 0.4%.
- 2024
- 2026, January to October
Bank-owned homes also sell for less than their neighbors. We compared each bank-owned sale's price per square foot with the median for standard resales in the same zip code and year. The median bank-owned sale came in at 84% of that figure in 2024, 81% in 2025 and 76% in 2026. Short sales came in at 87%. Part of the gap is condition: the median bank-owned home was built in 1972, against 1980 for other sales, and lenders sell as is. Cash buyers took 39% of bank-owned sales, against 21% of other sales. Bank-owned homes took a median 48 days to sell, against 31.
The sales are spread across the county but weighted to the south and east. From January 2025 through October 2026, Dallas had 182, Garland had 38, Mesquite had 37, Grand Prairie had 17, DeSoto had 16 bank-owned sales; 69 of 103 zip codes had at least one, and the 10 with the most accounted for 40%. Those figures describe where sales happened. They are no basis for treating a neighborhood or its residents as a credit risk, which fair lending law prohibits.

Median −14% from the purchase price
The largest group of distressed sellers bought in 2022 and 2023, and most sold for less than they paid
We matched each distressed sale since January 2024 to the home's previous MLS sale, using the street address. Our earlier records cover 2004 to 2012 and October 2020 onward, so a purchase from 2013 to September 2020 has no match. Of 563 distressed sales, 261 had an earlier MLS sale on record, and 186 of those earlier sales were in October 2020 or later. 129 were bought in 2022 or 2023. Those homes sold at a median 14% below their purchase price, and 18% below for the 91 owners who had bought with an FHA, VA or conventional loan. Homes bought in 2020 and 2021, before the run-up in prices peaked, sold for about what the owners paid (+0.9%).
- FHA (49)
- VA (21)
- Conventional (59)
- Cash (44)
- Other or unknown (13)
Data table
| Bought | Sales | Median change | Financed buyers | Median change, financed |
|---|---|---|---|---|
| 2020 to 2021 | 36 | 1% | 26 | −5% |
| 2022 to 2023 | 129 | −14% | 91 | −18% |
| 2024 to 2025 | 21 | −13% | 12 | −19% |
FHA and VA buyers were 38% of the earlier purchases behind these sales, against 24% of all Dallas County closings from 2024 to 2026. Those loans require the smallest down payments, so a price decline of 10% or more leaves the owner owing more than the home is worth. This is the local version of ICE's national finding, and it matches our Dallas County tier analysis, which estimated that many recent FHA, VA and USDA buyers are underwater, and our negative equity analysis by metro.
The numbers are small, 186 sales, and the match finds only homes whose earlier sale went through the MLS. Treat the percentages as the direction of the evidence.

Contracts −14% from October 2025
Fewer contracts, more unsold listings and larger concessions point to more distress in the months ahead
Bank-owned sales reflect defaults that began a year or more earlier. Four MLS measures move sooner, and all four weakened from October 2024 to October 2026. Buyers signed 1,216 contracts on Dallas County homes in October 2026, against 1,417 a year earlier and 1,462 two years earlier. Of the listings that left the market in October, 46% ended unsold (expired, cancelled or withdrawn), up from 36%. The median seller-paid concession rose from 1.87% of the price to 2.44%. Months of supply at the end of October went from 4.2 to 5.0.
Two measures moved the other way, and they belong in the picture. October's median days on market was 36 in 2026, against 45 in 2025, and fewer sales closed after a price cut (44% against 47%). Spring 2026 was the strongest selling season of the three years. The evidence describes a soft market with rising distress at the low end.
Concessions deserve particular attention in a valuation. In the 12 months to October, sellers paid concessions on 52% of Dallas County sales, and on 64% of sales from $300,000 to $500,000. A recorded price that includes a 2.4% seller credit overstates what the buyer paid for the house by about that much.

Stable on 87% of Dallas appraisals in 2023
Dallas appraisals have called values stable in rising and falling years alike, and the rules require a trend built from evidence
FHFA publishes counts of the property value trend checkbox on appraisals for loans delivered to Fannie Mae and Freddie Mac. In the Dallas-Plano-Irving metropolitan division, appraisers checked stable on 91% of appraisals in 2013, 90% in 2019 and 89% in 2020. In 2023, after mortgage rates rose, they checked stable on 87% and declining on 6.2%.19 Nationally, stable ran from about 79% to 85% of appraisals every year from 2013 through 2023 except 2021 and 2022, and reached 85.6% in the third quarter of 2024, the latest data FHFA has published. From 2013 through 2020, FHFA's own price index rose 4.3% to 6.3% a year.1922 Our analysis of falling markets found that in metro areas where prices fell over a full year, 3.6% of appraisals marked values declining.
- Increasing
- Stable (share shown)
- Declining
A checkbox answer is supposed to summarize an analysis. Fannie Mae's Selling Guide requires the appraiser to “report the primary indicators of market condition,” and says the trend “must reflect the overall movement of the market,” rest on “a minimum of 12 months of data,” and “must be reflective of those properties deemed to be competitive” to the subject. Declining values, over-supply or marketing times over six months each require the appraiser's reasons, and the analysis covers listings and contract sales as well as closings.10 When Fannie Mae stopped requiring its Market Conditions Addendum in August 2018, it said: “Appraisers remain responsible for analyzing market conditions and accurately reporting them.”20 Freddie Mac told lenders in December 2025 that appraisal reports “must contain support for both the reported market trend” and the adjustments made for it, and that “Failure to apply market condition adjustments when they're warranted is an unacceptable appraisal practice.”13
USPAP, the standards every Texas appraiser must follow under the licensing board's rules,21 requires an appraiser to analyze market area trends, supply and demand when they are necessary for credible results, and to avoid unsupported assumptions about market trends. It requires recognized methods free of substantial errors of omission, and reports that are clear, accurate and not misleading.16 Checking stable out of habit, in a segment where prices are falling, fails each of those tests.
FHFA has measured how rarely appraisers adjust for time. In a sample of appraisals from 2018 to 2021, comparable sales were typically about six months old, which implied average adjustments of roughly 2.5% to 9% of the sale price, and through much of that period appraisers time-adjusted fewer than 10% of comparables. A later FHFA working paper covering 2015 to 2023 found the adjustment made for around 10% of properties.1415 Fannie Mae and Freddie Mac tightened the rules together in November 2024. Fannie Mae's Selling Guide now says the appraiser “must analyze comparable sales for any changes in market conditions from their contract dates through the effective date,” and that “Time adjustments, or the lack thereof, must be supported by evidence.”12 A zero adjustment is a conclusion, and it needs the same support as any other. FHA's handbook, as amended in 2025, still tells appraisers that negative market condition adjustments “should be applied if there is sufficient proof of the trend from a credible source.”17 Our UAD 3.6 sales grid explainer shows where the adjustment now goes on the form.
The new form
The redesigned Uniform Residential Appraisal Report became mandatory for new submissions on Nov. 2, 2026. It has no trend checkbox: Fannie Mae and Freddie Mac deleted the Property Value Trend field in a September 2024 revision. The appraiser reports search counts for active listings, pending sales and settled sales, answers whether distressed sales compete with the subject, and states the trend in Price Trend Analysis Commentary.18 Our guide to the Market section covers each field. A one-line commentary that calls the market stable gives a reviewer the same information the checkbox did.
Dallas County shows why a single answer for a whole market area misleads. Over the 12 months to Oct. 31, 2026, the county's median price per square foot was −2.2% from the prior 12 months, a figure many reports would round to stable. Split by price, the same county shows two markets moving in opposite directions.
Under $300,000, the median price per square foot fell 3.2%, and 3.3% after concessions. Distressed sales were 3.7% of that segment's sales, 82 distressed listings were active on Oct. 31, and the median concession was 2.8% of the price. Above $500,000, the median rose 4.2%, distressed sales were 0.4%, and the median concession was 1.0%. For a $240,000 ranch house, Fannie Mae's competitive-properties rule points the appraiser to the first set of numbers. For a $650,000 house in the same county, it points to the second.
The error runs in both directions. At the 12-month rate, a six-month-old comparable under $300,000 left unadjusted overstates value by about 1.6%, before any adjustment for the concession or the bank-owned competition. Above $500,000, the same unadjusted comparable understates value by about 2.1%, the pattern FHFA documented in rising markets. Medians move with the mix of homes that sell, so these are segment-level indicators to test against paired sales and repeat sales in the subject's own neighborhood. The rules require that test, and checking stable out of habit skips it.
The appraisers are working inside real constraints. Sales data reach them with a lag, and a small neighborhood can have too few sales to measure a trend. The legacy form offered three boxes for a market that moves by segment. Those constraints explain the pattern and leave the requirement unchanged. On the new form, a reviewer can see the analysis, or its absence.
| Rule | Requirement | Dallas County evidence | What a supported report includes |
|---|---|---|---|
| USPAP Standards Rule 1-3(a)16 | Identify and analyze market area trends, supply and demand where they are necessary for credible results. | Under $300,000, price per square foot fell 3.2% over 12 months while it rose 4.2% above $500,000. | A trend for the competitive segment, with its data and period stated. |
| USPAP Standards Rules 1-1 and 2-1, Ethics Rule16 | Use recognized methods without substantial errors of omission; report clearly and accurately, in a way that is not misleading. | A county-wide reading of −2.2% averages a falling bottom and a rising top. | Reasons for the trend selected, and the evidence that would contradict it. |
| Fannie Mae B4-1.3-0310 | Report the primary indicators of market condition; base the trend on at least 12 months of data on competitive properties; give reasons for declining values, over-supply or marketing over six months; analyze listings and contract sales. | 1,776 active and 433 pending listings under $300,000 on Oct. 31; 5,405 sales in 12 months. | Active, pending and settled counts for the same segment, and what they show. |
| Fannie Mae B4-1.3-0811 | Address the prevalence of foreclosure and short sales; never assume a distressed sale equals the subject. | Distressed sales were 3.7% of sales under $300,000, and bank-owned homes sold at 76% of the zip's standard price per sq ft. | The distressed share, and how each distressed comparable was adjusted. |
| Fannie Mae B4-1.3-09; Freddie Mac1213 | Analyze market change between each comparable’s contract date and the effective date, and support the adjustment, including zero. | A six-month-old sale under $300,000 is about 1.6% high at the 12-month rate; above $500,000 about 2.1% low. | A time adjustment on each comparable, with the method shown. |
| UAD 3.6 Market section18 | Search metrics for listings, pendings and sales; Distressed Market Competition; price trend commentary. The trend checkbox was removed. | 82 distressed listings were active under $300,000 on Oct. 31. | Commentary that states the trend and its basis, beside the metrics. |

Pick a price range
The same county, four Market sections
Choose a price range to see the search metrics an appraiser would report for it as of Oct. 31, 2026, and a commentary built from those numbers. The commentary illustrates what a supported trend statement can contain. A real assignment uses the subject's competitive market area, which is usually far smaller than a county.
All price ranges Market section, effective date Oct. 31, 2026
- Active listings
- 6,453
- Pending sales
- 1,265
- Settled sales, past 12 months
- 16,617
- Absorption, sales a month
- 1,385
- Months of supply
- 4.7
- Median days on market, active
- 60
- Distressed share of sales
- 1.7%
- Distressed listings, active
- 138
- Price per sq ft, 12-month change
- −2.2%
- Net of concessions
- −2.4%
- Sales with seller concessions
- 52%
- Active listings with a price cut
- 57%
Commentary, illustrationOver the 12 months to Oct. 31, 2026, the median sale price per square foot of single-family homes in Dallas County was $194, −2.2% from the prior 12 months (−2.4% after seller-paid concessions). 16,617 sales closed, about 1,385 a month. On Oct. 31, 6,453 listings were active and 1,265 were pending, 4.7 months of supply at that pace. Bank-owned, short and pre-foreclosure sales made up 1.7% of sales, and 138 such listings were active. Sellers paid concessions on 52% of sales, a median 2.1% of price, and 57% of active listings had cut their asking price.
Under $300,000 Market section, effective date Oct. 31, 2026
- Active listings
- 1,776
- Pending sales
- 433
- Settled sales, past 12 months
- 5,405
- Absorption, sales a month
- 450
- Months of supply
- 3.9
- Median days on market, active
- 60
- Distressed share of sales
- 3.7%
- Distressed listings, active
- 82
- Price per sq ft, 12-month change
- −3.2%
- Net of concessions
- −3.3%
- Sales with seller concessions
- 54%
- Active listings with a price cut
- 59%
Commentary, illustrationOver the 12 months to Oct. 31, 2026, the median sale price per square foot of single-family homes under $300,000 in Dallas County was $164, −3.2% from the prior 12 months (−3.3% after seller-paid concessions). 5,405 sales closed, about 450 a month. On Oct. 31, 1,776 listings were active and 433 were pending, 3.9 months of supply at that pace. Bank-owned, short and pre-foreclosure sales made up 3.7% of sales, and 82 such listings were active. Sellers paid concessions on 54% of sales, a median 2.8% of price, and 59% of active listings had cut their asking price.
$300,000 to $500,000 Market section, effective date Oct. 31, 2026
- Active listings
- 2,407
- Pending sales
- 420
- Settled sales, past 12 months
- 5,870
- Absorption, sales a month
- 489
- Months of supply
- 4.9
- Median days on market, active
- 63
- Distressed share of sales
- 1.1%
- Distressed listings, active
- 42
- Price per sq ft, 12-month change
- −1.8%
- Net of concessions
- −2.1%
- Sales with seller concessions
- 64%
- Active listings with a price cut
- 59%
Commentary, illustrationOver the 12 months to Oct. 31, 2026, the median sale price per square foot of single-family homes from $300,000 to $500,000 in Dallas County was $184, −1.8% from the prior 12 months (−2.1% after seller-paid concessions). 5,870 sales closed, about 489 a month. On Oct. 31, 2,407 listings were active and 420 were pending, 4.9 months of supply at that pace. Bank-owned, short and pre-foreclosure sales made up 1.1% of sales, and 42 such listings were active. Sellers paid concessions on 64% of sales, a median 2.3% of price, and 59% of active listings had cut their asking price.
$500,000 and up Market section, effective date Oct. 31, 2026
- Active listings
- 2,270
- Pending sales
- 412
- Settled sales, past 12 months
- 5,342
- Absorption, sales a month
- 445
- Months of supply
- 5.1
- Median days on market, active
- 59
- Distressed share of sales
- 0.4%
- Distressed listings, active
- 14
- Price per sq ft, 12-month change
- +4.2%
- Net of concessions
- +4.3%
- Sales with seller concessions
- 37%
- Active listings with a price cut
- 54%
Commentary, illustrationOver the 12 months to Oct. 31, 2026, the median sale price per square foot of single-family homes of $500,000 and up in Dallas County was $318, +4.2% from the prior 12 months (+4.3% after seller-paid concessions). 5,342 sales closed, about 445 a month. On Oct. 31, 2,270 listings were active and 412 were pending, 5.1 months of supply at that pace. Bank-owned, short and pre-foreclosure sales made up 0.4% of sales, and 14 such listings were active. Sellers paid concessions on 37% of sales, a median 1.0% of price, and 54% of active listings had cut their asking price.
Questions the data above can answer
What a collateral desk and an appraiser can check now
- Compare the reported trend with data for the subject's price range. In Dallas County the 12-month change ran from −3.2% under $300,000 to +4.2% above $500,000. A stable reading on a low-priced home needs support from that segment's data.
- Check the Distressed Market Competition answer against the listings. Under $300,000, 3.7% of sales and 82 active listings were distressed on Oct. 31. A report that answers no in that segment should say why.
- Review every bank-owned or short-sale comparable for condition and sale conditions. Fannie Mae requires the appraiser to address their prevalence and prohibits treating them as equal to the subject. Bank-owned homes sold at 76% of their zip's standard price per square foot in 2026.
- Look for time adjustments on comparables more than three months old. A zero adjustment is a claim that prices held flat between the contract date and the effective date, and it needs the same support as any other figure.
- Check concessions on each comparable. Half of Dallas County sales carried seller concessions in the past year, with a median of 2.1% of price, and more under $500,000.
- Watch the leading measures by month. Contracts, unsold listings, concessions and months of supply moved first in 2026. Distressed listings lead bank-owned closings by one to three months.
For an appraiser
- Build the trend from the competitive segment's 12-month data, including listings and pending sales, and state the period and the measure used.
- When distressed sales are present, report their share and show how each one was adjusted or why it was left out.
- Write the trend commentary so a reviewer can test it: the numbers, their source and what would change the conclusion.
Method and limits
- Data. MLS exports for Dallas County single-family listings, downloaded Nov. 14, 2026: 88,574 unique listings with a status change since November 2023, including 50,834 closed and 30,053 expired, cancelled or withdrawn. Earlier exports supply closings for 2004 to 2012 and October 2020 to 2023. Every published figure ends Oct. 31, 2026, so recent closings had two weeks to be reported; agents report some closings late, so October 2026 counts may rise slightly.
- Distress flags. Bank-owned means the MLS Special Listing Conditions field includes Real Estate (Bank) Owned or HUD Owned. Short sale and pre-foreclosure (In Foreclosure, Notice of Default) come from the same field. A search of listing remarks for foreclosure, bank-owned, REO and short-sale wording found 13 closings with that wording and no flag, against 563 flagged; we use the flags.
- Older records. The 2004 to 2012 shares come from the same field in older MLS records. The share near one in three from 2008 to 2011 matches the scale of distress reported for Texas in those years; we have not checked the coding of legacy records against an outside count.
- Price ranges and trends. Price ranges use the sale price for closings and the list price for active and pending listings. Price per square foot is the sale price over the MLS living area; the net figure subtracts seller-paid concessions. The 12-month change compares medians for Nov. 1, 2025 to Oct. 31, 2026 with the prior 12 months, and medians shift with the mix of homes sold.
- Supply. A listing counts as active from its listing date until a contract, a closing or an expiration, cancellation or withdrawal. Months of supply divides month-end active listings by average monthly closings over the trailing three months; the Market section figures use the 12-month absorption rate.
- Prior purchases. We matched distressed sales to an earlier closed sale by zip code, street number and the first six letters of the street name, at least 60 days before the distressed sale, keeping the latest. Parcel numbers in the exports are unreliable. A few matches show changes beyond −60% or +80%, likely a different unit or a rebuilt home; the chart draws them at the edge and the medians include them.
- National figures. ATTOM, ICE, MBA and the New York Fed figures come from the releases cited. Each measures a different population, as chapter 02 explains.
- Privacy. Published figures are aggregates. The chart of prior purchases shows each sale's purchase quarter and rounded change only.
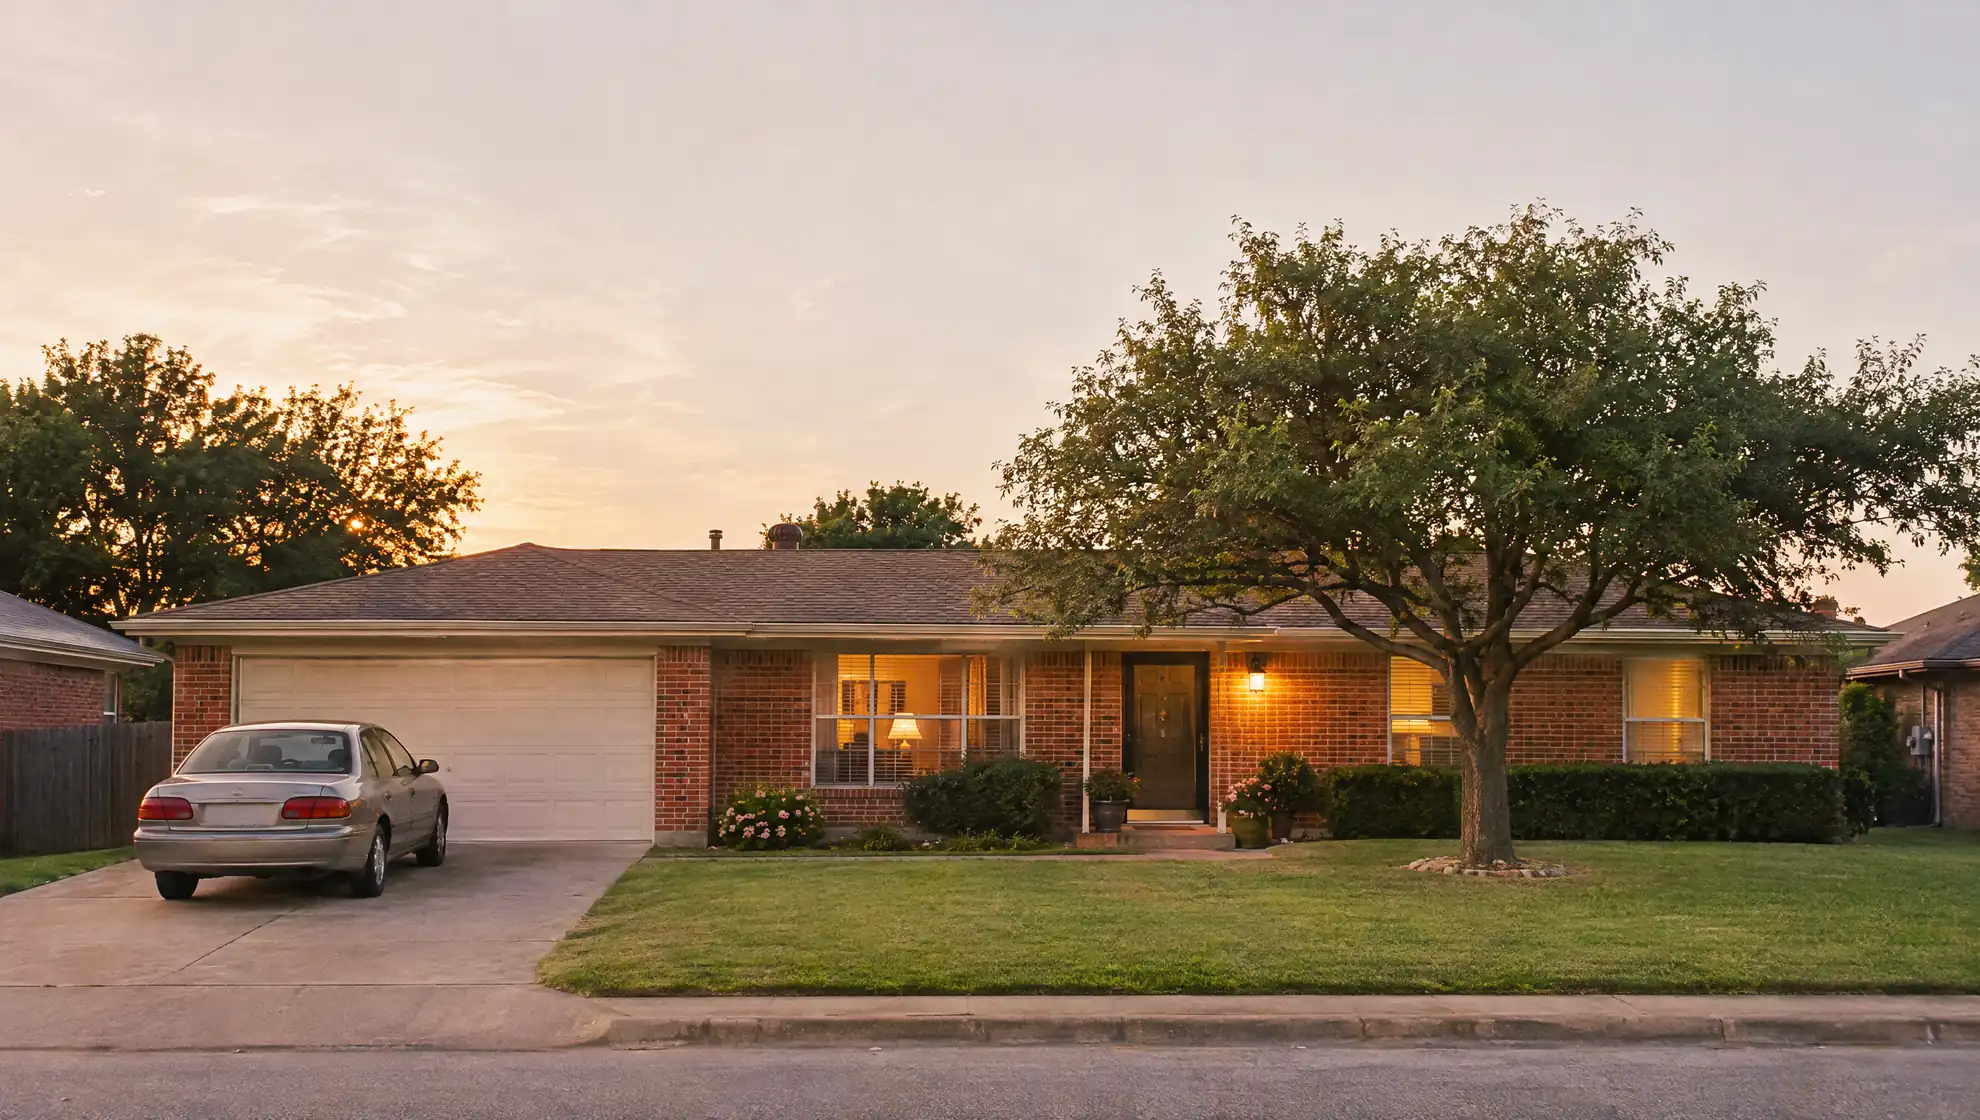
This article is general information, not legal, credit or valuation advice. Images marked as illustrations are AI-generated and show no real property. The Dallas County figures are The Signal's analysis of MLS data; every other figure comes from the cited source.
Sources
- ATTOM, U.S. Foreclosure Activity Increases in 2025 (Year-End 2025 U.S. Foreclosure Market Report) (Jan. 15, 2026)
- ATTOM, Foreclosure Activity Posts Annual Increase in First Half of 2026 (Mid-Year 2026 U.S. Foreclosure Market Report) (July 16, 2026)
- ATTOM, Foreclosure Activity Remains Above Year-Ago Levels in August 2026 (Sept. 17, 2026)
- ATTOM, U.S. Foreclosure Activity Doubles Annually in 2022 (Year-End 2022 U.S. Foreclosure Market Report) (January 2023)
- ATTOM, U.S. Foreclosure Activity Drops to an All-Time Low in 2021 (Year-End 2021 U.S. Foreclosure Market Report) (January 2022)
- ATTOM, 2023 U.S. Foreclosure Market Report (January 2024)
- ICE, First Look at September 2026 Mortgage Data (Oct. 27, 2026)
- Mortgage Bankers Association, Mortgage Delinquencies Decrease Slightly in the Second Quarter of 2026 (National Delinquency Survey), MBA NewsLink (Aug. 14, 2026)
- Federal Reserve Bank of New York, Quarterly Report on Household Debt and Credit, 2026 Q3 (Nov. 10, 2026)
- Fannie Mae Selling Guide B4-1.3-03, Neighborhood Section of the Appraisal Report (June 4, 2025)
- Fannie Mae Selling Guide B4-1.3-08, Comparable Sales (June 4, 2025)
- Fannie Mae Selling Guide B4-1.3-09, Adjustments to Comparable Sales (June 4, 2025)
- Freddie Mac, Neighborhoods, Market Areas and Market Conditions for Lenders (Dec. 12, 2025)
- Susin, Scott. Underutilization of Appraisal Time Adjustments. Federal Housing Finance Agency, FHFA Insights (Jan. 8, 2024)
- Doerner, William M., and Scott Susin. Underappraisal Disparities and Time Adjustments to Comparable Sales Prices in Mortgage Appraisals. FHFA Staff Working Paper 24-07 (November 2024)
- The Appraisal Foundation, Appraisal Standards Board, Uniform Standards of Professional Appraisal Practice, 2024 Edition (effective Jan. 1, 2024)
- U.S. Department of Housing and Urban Development, Mortgagee Letter 2025-18, amending Single Family Housing Policy Handbook 4000.1, including section II.D.4.c.iii(F) (June 27, 2025)
- Fannie Mae and Freddie Mac, Appendix F-1: URAR Reference Guide, v1.4; Freddie Mac, UAD and Forms Redesign FAQs (March 10, 2026; accessed Nov. 14, 2026)
- Federal Housing Finance Agency, Uniform Appraisal Dataset Aggregate Statistics, Enterprise single-family national and metro files (v3.3) (data through Q3 2024)
- Fannie Mae, Selling Guide Announcement SEL-2018-06 (Aug. 7, 2018)
- 22 Texas Administrative Code § 153.20, Guidelines for Disciplinary Action (Texas Appraiser Licensing and Certification Board) (accessed Nov. 14, 2026)
- Federal Housing Finance Agency, House Price Index, all-transactions, United States (via FRED) (accessed Nov. 14, 2026)
- Calculated Risk, MBA: Loans in Foreclosure Tie All Time Record (reporting the MBA National Delinquency Survey, Q4 2010) (Feb. 17, 2011)
- Texas Property Code § 51.002, Sale of Real Property Under Contract Lien (accessed Nov. 14, 2026)
The Signal / Twice-monthly briefing
Get the next data feature in The Signal.
One sourced briefing, twice a month.
Unsubscribe in one click. We don't sell your email or share it with sponsors. Privacy Policy